
Project: FREE policy brief
Five Million Tourists in Georgia by 2015 – a Myth or a Nightmarish Reality?

Anybody traveling on the Georgian countryside will be astonished by the pace of development. Mestia, the capital of Svaneti, resembles one big construction site. The new concrete road from Zugdidi promises to shorten the travel time to 2 hours. A whole network of ski lifts is currently being planned, carrying a promise of turning Svaneti, a long-isolated region of Georgia, into the Switzerland of the Caucasus.
Mestia and Svaneti are representative of a broader effort by the Georgian government, assisted by international financial institutions, to develop the Georgian tourism sector. This has mainly involved infrastructure projects and tax breaks to encourage private investment in the tourism industry. A very partial list of touristic destinations that have received or are receiving a major facelift includes Old Tbilisi, Mtskheta, Signagi, Kutaisi, Gudauri, Mestia, Batumi, Kobuleti and Anaklia.
Tourism is one of Georgia’s main exporting sectors and earns hard currency and helps to reduce the current account deficit. As a labor intensive industry, it helps to create a lot of formal and informal jobs (particularly in the periphery where they are most needed). The growth in tourism also spurs business development in many related sectors of the economy – agriculture, transportation services, arts and crafts to name just a few.
Georgia is not the only country in the world riding on the wave of tourism expansion. Tourism is currently the fastest growing sector in the global economy, particularly important for developing countries. According to UNWTO tourism barometer, the flow of foreign tourists into developing countries increased by 4.5% in 2011 compared to the previous year. The rate of increase stands at 9% for Central and Eastern European countries.
For Georgia, however, the growth of tourism has been truly spectacular. According to the Georgian Border Security statistics, the number of foreigners visiting Georgia during the first 10 months in 2011 increased by 42% compared to the same period last year. While not reflecting the actual number of tourists (as opposed to foreigners working in Georgia and buyers of re-exported cars), these data illustrate a steep upward trend. Even under most conservative assumptions, the total number of border crossings by foreigners will reach about 2.6 million by the end of 2011, which is 28% above the 2010 level.
Since 2004, incoming tourism has expanded at an impressive average rate of 32% per year, nearly doubling every three years. A simple (simplistic) extrapolation suggests that in four more years, by 2015, Georgia may be receiving more than 5million tourists a year. Is this a realistic estimate? Would it be a blessing or a curse?

What the border crossings statistics conceal is that Georgia remains a very expensive destination, especially during the short high season. According to Travel and Tourism Competitiveness Index for 2011, Georgia is ranked 73rd among 139 countries, the same ranking as in 2009. In particular, Georgia ranked 82nd on information and communication technologies, 105th on air transportation infrastructure and 94th on general infrastructure. Overall, Georgia does better than its South Caucasus neighbors Armenia (100th) and Azerbaijan (87th) but worse than Russia (53rd) and Turkey (50th).
At present, tourists are willing to pay a significant premium to satisfy their curiosity for this Eastern outpost of Western civilization. Despite high prices and mediocre quality of services, Georgia has so far been able to maintain its attraction as an island of democracy; exotic, underexplored and yet secure location with good food and wine. However, as the country enters a period of two closely watched elections in 2012 and 2013, what will be at stake, among other things, is Georgia’s status as a destination of choice for investors, donors, and tourists. As far as mass tourism is concerned, a setback in the global public relations battle could bring into play the “value for money“ factor, making further expansion in the sector more tightly related to infrastructure and service improvements.
Slower growth in tourism may be a blessing in disguise. From the purely economic point of view one has to consider the impact of tourism on long-term economic growth. Unfortunately, tourism – like many other labor intensive service industries – has little potential for substantial productivity growth: it takes about the same amount of labor to cook one khachapuri today as it did in the 19th century. As wages are typically tied to productivity this means that tourism has little potential for long-term income growth. Wages in tourism may eventually increase – a phenomenon known to economists as “Baumol’s cost disease” – when other sectors improve their productivity and start competing for workers with the tourism industry.
Thus, the Georgian government should be advised to worry, not about the sheer number of tourists, but rather the amount of money the tourists spend in the country. According to this view, Georgia should strive to increase the share of relatively wealthy tourists from Western Europe and North America. These tourists account for a meager 3.6% of total border crossings by foreigners in the first 10 months of 2011. A closely related goal should be to smooth the sharp seasonal fluctuations currently plaguing the industry. High season tourism (mainly from the CIS) at “peak load” prices has been growing so far, but there is ultimately a limit to how many tourists Batumi, Kobuleti and Anaklia can absorb in July and August. After all, there are cheaper and better mass-tourism alternatives on the Turkish side of the border. Conversely, increasing offseason tourism would help attract additional investment in human and physical capital and raise the quality of services to a level appropriate for high-end tourism.
Along with the economic pitfalls outlined above, the danger associated with becoming just another “Disneyland” of mass tourism is in losing the very reason why people would want to come to Georgia, as well as losing a part of the national identity. The magnificence of Georgian landscapes is in the wild, untamed nature of their beauty. It is also one of the very few places in Europe where one can still witness and appreciate the tenacity and courage of people who do not merely survive, but “live with” the land, with the nature that is both generous and unforgiving.
Of course, we almost always accept as inevitable the sacrifice of “tradition” for “progress”. Most of the time, it is difficult to tell whether the changes we are going through are for the better or for the worse. In particular, it may depend on what people perceive to be the “core” of their identity. Our feeling is that Georgians as a people have been formed to a great extent by the freedom, the wilderness, and the power of their mountains. Any successful and smart approach to developing the tourism industry would take into consideration these important cultural aspects as well.
▪
Development Programs and Security in Afghanistan

This policy brief summarizes the results of recent research which studies the effect of a development program in Afghanistan on the security situation there. We use a large-scale randomized field experiment to examine the effect of the largest development program in Afghanistan on the economic wellbeing of villagers and their attitudes toward the government and the security situation. We find that implementation of the program leads to significant improvement in villagers’ economic wellbeing as well as in their attitudes towards the government. The program also leads to an improved security situation in the long run. However, these positive effects on attitudes and security are not observed in districts with high levels of initial violence.
Development programs have long been used to promote economic and political development. In recent years, however, they have assumed yet another role: they have been used to promote security in countries fighting fierce insurgencies, such as Afghanistan and Iraq. The approach contends that such projects, which are commonly used by the domestic government and allied entities to provide basic services and infrastructure, improve economic outcomes, build support for the government, and ultimately reduce violence as sympathy of the population for the insurgency wanes. The idea of using development projects as a counter-insurgency strategy is becoming more and more influential and now constitutes a major component of the new U.S. counterinsurgency doctrine (U.S. Army/Marine Corps, 2006).
The study tests whether this approach works in the context of the National Solidarity Program (NSP) in Afghanistan. NSP is the largest development program in the country and has already brought almost $1 billion in aid to more than 26,000 Afghan communities. Under the supervision of the program communities elect a council, which assumes responsibility for implementing infrastructure projects (e.g. building wells or repairing roads) that are chosen by the villagers and are funded by block grants from the NSP.
To measure the effects of the program, the study uses a field experiment conducted in 500 villages across 10 Afghan districts spanning all parts of the country except for the southern provinces, where security levels were insufficient for the study to be carried out. The experiment divided the villages randomly into two groups of the same size, one of which received the program in autumn 2007, while the other group was to receive the program four years later. Before the start of the program the villages in these two groups were virtually identical, so their comparison over the course of these years shows the effect of the program on the life of village communities. The study uses the results of the extensive survey conducted in these villages two years after the start of the program as well as military information on security incidents around the villages during this period.
Our findings indicate that NSP has a strong positive effect on people’s economic wellbeing and on their attitudes towards the Afghan government (both at the central and local level). NSP also appears to improve attitudes toward NGOs and, to some extent, coalition forces on the ground. Respondents in NSP villages have significantly more positive attitudes toward government figures at almost all levels, including district and provincial governors, central government officials, the President of Afghanistan, Members of Parliament and government judges. Magnitude of effects varies from between 8 percentage points for Members of Parliament to 4 percentage points for the national police. NSP also has a positive effect on the attitudes of villagers toward NGOs and soldiers of the International Security Assistance Force (ISAF). The results for the summary measure indicate that NSPs improve villagers’ attitudes by 13 percent of a standard deviation. However, results for the two eastern districts, which experienced high initial levels of violence, are completely different. There is no positive effect of NSP on attitudes toward any government bodies, ISAF soldiers, or NGOs, and the effect on attitudes towards many figures is, in fact, significantly negative.
The results also indicate that villagers have more positive perceptions about security in NSP villages. There is no evidence, however, that the program affects the number of security incidents around villages recorded by NATO coalition forces (ISAF) in the short run (the first 15 months after the start of the program) or the number of security incidents reported by villagers in the survey. However, NSP does reduce the probability of security incidents in the long-run. The probability that a security incident will occur in one- and ten-kilometer radius around a village is smaller in treatment villages by 2 and 4 percentage points, respectively. For a three-kilometer radius, the probability is lower by 2 percentage points, but not statistically significant. In the two eastern districts, the short-run effect is similar to the average effect, but there are no statistically significant differences between treatment and control villages in long-run effects.
Overall, the empirical evidence suggests that strategies for winning the “hearts and minds” through the provision of development projects are working, but only in relatively secure regions. The development program improves the attitudes of the civilian population toward the government and makes them more likely to think that the government is working in their best interest, which in turn makes them less likely to support the insurgents. The fact that we observe the effect on security only in the long run suggests that support for the government reduces violence mainly by reducing the number of people willing to join the insurgents, rather than by increasing the population’s willingness to share information with the government. The results also suggest that development programs can prevent the spread of violence in relatively secure regions, but they are not effective in reducing violence in regions that are already experiencing significant security problems.
Overall, the results suggest that the benefits of development programs are not limited to the provision of direct economic and social benefits. They can also contribute to long-term sustained development by preventing the spread of violent internal conflicts, which are the core problem in many developing countries.
Disclaimer: Opinions expressed in policy briefs and other publications are those of the authors; they do not necessarily reflect those of the FREE Network and its research institutes.
▪
Are Natural Resources Good or Bad for Development?

Natural resources development undoubtedly plays an important role in the economies of many countries. Whether their contribution to development is positive or negative is, however, a contested and difficult question. Arguably, countries like Australia, Botswana, and Norway have gained enormously over long periods from sustained natural resources development. Others, such as Azerbaijan, Kazakhstan, and Russia, have achieved significant economic growth through natural resources development but perhaps at the expense of institutional progress. In contrast, in some countries—such as Angola and Sierra Leone—natural resources development has been at the heart of violent conflicts, with devastating consequences for society. With many developing countries being highly resource-dependent, a deeper understanding of the sources of success and the risks associated with natural resources development is highly relevant. This brief reviews the main issues and points to key policy challenges for transforming resource rents from natural resources development into a driver rather than a detriment to overall development.
Is it good for a country to be rich in natural resources? Superficially, the answer to this question would obviously seem to be “yes”. How could it ever be negative to have something in addition to labor and produced capital? How could it be negative to have something valuable “for free”? Yet, the answer is far from that simple and one can relatively quickly come up with counterarguments: “Having natural resources takes away incentives to develop other areas of the economy which are potentially more important for long-run growth”; “Natural resource-income can cause corruption or be a source of conflict”, etc.
Looking at some of the starkest cases, the “benefits” of resources can indeed be questioned. Take the Democratic Republic of Congo for example. It is the world’s largest producer of cobalt (49% of the world’s production in 2009) and of industrial diamonds (30%). It is also a large producer of gemstone diamonds (6%), it has around 2/3 of the world’s deposits of coltan and significant deposits of copper and tin. At the same time, it has the world’s worst growth rate and the 8th lowest GDP per capita over the last 40 years.[1] The picture for Sierra Leone and Liberia is very similar – they possess immense natural wealth, yet they are found among the worst performers both in terms of economic growth and GDP per capita. While the experiences of countries such as Bolivia and Venezuela are not as extreme their resource wealth in terms of natural gas and oil, respectively, seems to have brought serious problems in terms of low growth, increased inequality and corruption. When one, on top of this, adds that some of the world’s fastest-growing economies over the past decades – such as Hong Kong, South Korea and Singapore – have no natural wealth the picture that emerges is that resources seem to be negative for development.
These are not isolated examples. By now, it is a well-established fact that there is a robust negative relationship between a country’s share of primary exports in GDP and its subsequent economic growth. This relationship, first established in the seminal paper by Sachs & Warner (1995) is the basis for what is often referred to as the resource curse, that is, the idea that resource dependence undermines long-run economic performance.[2]
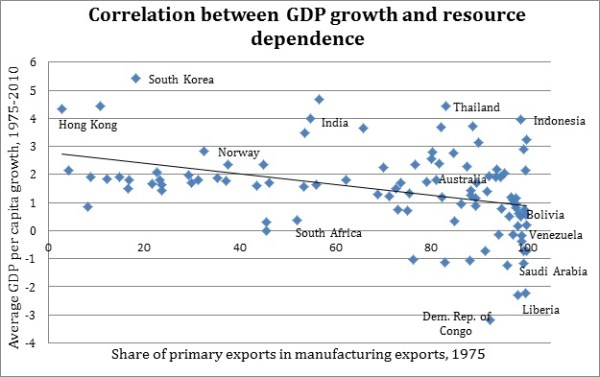
Based on the World Development Indicators database (World Bank). Primary exports consist of agricultural raw materials exports, fuel exports, ores and metals, and food exports.
At the same time, there are numerous countries that provide counterexamples to this idea. Being the second largest exporter of natural gas and the fifth largest of oil, Norway is one of the richest world economies. Botswana produces 29% of the world’s gemstone diamonds and has been one of the fastest-growing countries over the last 40 years. Australia, Chile, and Malaysia are other examples of countries that have performed well, not just despite their resource wealth, but, to a large extent, due to it.
Given these examples the relevant question becomes not “Are resources good or bad for development?” but rather “Under what circumstances are resources good and when are they bad for development?. As Rick van der Ploeg (2011) puts it in a recent overview: “the interesting question is why some resource-rich economies [.] are successful while others [.] perform badly despite their immense natural wealth”. To begin to answer this question it is useful to first review some of the many theoretical explanations that have been suggested and to see what empirical support they have received. Clearly, our overview is far from complete but we think it gives a fair picture of how we have arrived at our current stage of knowledge.[3]
Theories and Evidence
The most well-known economic explanation of the resources curse suggests that a resource windfall generates additional wealth, which raises the prices of non-tradable goods, such as services. This, in turn, leads to real exchange rate appreciation and higher wages in the service sector. The resulting reallocation of capital and labor to the non-tradable sector and to the resource sector causes the manufacturing sector to contract (so-called “de-industrialization”). This mechanism is usually referred to as “Dutch disease” due to the real exchange rate appreciation and decrease in manufacturing exports observed in the Netherlands following the discovery of North Sea gas in the late 1950s. Of course, the contraction of the manufacturing sector is not necessarily harmful per se, but if manufacturing has a higher impact on human capital development, product quality improvements and on the development of new products, this development lowers long-run growth.[4] Other theories have focused on the problems related to the increased volatility that comes with high resource dependence. In particular, it has been suggested that irreversible and long-term investments such as education decrease as volatility goes up. If human capital accumulation is important for long-run growth this is yet another potential problem of resource wealth.
The empirical support for the Dutch disease and related mechanisms is mixed. Some authors find that a resource boom causes a decline in manufacturing exports and an expansion of the service sector (e.g. Harding and Venables (2010)), others do not (e.g. Sala-i-Martin and Subramanian (2003)). But even the studies that do find evidence of the Dutch disease mechanism, usually do not analyze its effect on the growth rates. In principle, Dutch disease could be at work without this hurting growth. Another problem is that the Dutch disease theory suggests that natural resources are equally bad for development across countries. This means that the theories cannot account for the great heterogeneity of observed outcomes, that is, they cannot explain why some countries fail and others succeed at a given level of resource dependence. The same goes for the possibility that natural resources create disincentives for education. Gylfason 2001, Stijns (2006) and Suslova and Volchkova (2007) find evidence of lower human capital investment in resource-rich countries but the theory cannot explain differences across (equally) resource-rich countries.
As a result, greater attention has been devoted to the political-economic explanations of the resource curse. The main idea in recent work is that the impact of resources on development is heavily dependent on the institutional environment. If the institutions provide good protection of property rights and are favourable to productive and entrepreneurial activities, natural resources are likely to benefit the economy by being a source of income, new investment opportunities, and of potential positive spillovers to the rest of the economy. However, if property rights are insecure and institutions are “grabber-friendly”, the resource windfall instead gives rise to rent-seeking, corruption and conflict, which have a negative effect on the country’s development and growth. In short, resources have different effects depending on the institutional environment. If institutions are good enough resources have a positive effect on economic outcomes, if institutions are bad, so are resources for development.
Mehlum, Moene and Torvik (2006) develop a theoretical model for this effect and also find empirical support for the idea. In resource-rich countries with bad institutions incentives become geared towards “grabbing resource rents” while in countries where institutions render such activities difficult resources contribute positively to growth. Boschini, Pettersson and Roine (2007) provide a similar explanation but also stress the importance of the type of resources that dominate. They show that if a country’s institutions are bad, “appropriable” resources (i.e., resources that are more valuable, more concentrated geographically, easier to transport etc. – such as gold or diamonds) are more “dangerous” for economic growth. The effect is reversed for good institutions – gold and diamonds do more good than less appropriable resources. In turn, better institutions are more important in avoiding the resource curse with precious metals and diamonds than with mineral production. The following graph illustrates their result by showing the marginal effects of different resources on growth for varying institutional quality. Distinguishing the growth contribution of mineral production in countries with good institutions with the effect in countries with bad institutions, the left panel shows a positive effect in the former and a negative one in the latter case. The right-hand panel illustrates the corresponding, steeper effects when isolating only precious metals and diamond production.

Even if these papers provide important insights and allow for the possibility of similar resource endowments having variable effects depending on the institutional setting, two major problems still remain. First, the measures of “institutional quality” are broad averages of institutional outcomes (rather than rules).[5] Even if Boschini et al. (2007), and in particular Boschini, Pettersson and Roine (2011) test the robustness of the interaction result using alternative institutional measures (including the Polity IV measure of the degree of democracy) it remains an important issue to understand more precisely which aspects of institutions that matter. An attempt at studying a particular aspect of this question is the paper by Andersen and Aslaksen (2008), which shows that presidential democracies are subject to the resource curse, while it is not present in parliamentary democracies. They argue that this result is due to higher accountability and better representation of the parliamentary regimes.
A second remaining issue is that even if one concludes that the impact of natural resources differs across institutional environments it is an obvious possibility that natural resources have an impact on the chosen policies and institutional arrangements. For example, access to resource rents may provide additional incentives for the current ruler to stay in power and to block institutional reforms that threaten his power, such as democratization. In a well-known paper with the catchy title “Does oil hinder democracy?” Ross (2001) uses pooled cross-country data to establish a negative correlation between resource dependence and democracy.
However, one needs to be careful in distinguishing such a correlation from a causal effect. There are at least two issues that can affect the interpretation: First, there could be an omitted variable bias, that is, the natural resource dependence and institutional environment can be influenced by an unobserved country-specific variable, such as historically given institutions (which in turn could be the result of unobserved effects of resources in previous periods), culture, etc. For the same reason, cross-country comparisons may also be misleading. One way of dealing with this problem is to use fixed-effect panel regressions to eliminate the effect of the country-specific unobserved characteristics. This approach produces mixed empirical results: in the analysis of Haber and Menaldo (2011) the effect of resources on democracy disappears, while Aslaksen (2010) and Andersen and Ross (2011) find support for a political resource curse.
Second, the measures of natural resource wealth may be endogenous to institutions and, in particular, its level of democracy. For example, the level of oil production and even the efforts put into oil discovery can be affected by the decisions of (and constraints on) those in power. Thereby one would need to find instrumental variables that influence the level of democracy only through the resource measures.[6] Tsui (2011) investigates the causal relationship between democracy and resources by looking at the impact of oil discovery event(s) on a cross-country sample. His identification strategy is based on using the exogenous variation in oil endowments (an estimate of the total amount of oil initially in place) to instrument for the amount of total discovered oil to date. The idea is that, while the amount of oil discovered could well be influenced by the institutional environment, the size of the oil endowment is determined only by nature. Tsui’s findings also support the political resource curse story.
There are also numerous studies about the effect of resources on particular institutional aspects and policies. For example, Beck and Laeven (2006) find that resource wealth delayed reform in Eastern Europe and the CIS, Desai, Olofsgård and Yousef (2009) point to natural resource income as central for the possibilities of autocratic governments to remain in power through buying support, Egorov et. al. (2009) show that there is fewer media freedom in oil-rich economies, with the effect being the strongest for the autocratic regimes. Andersen and Aslaksen (2011) find that natural resource wealth only affects leadership duration in non-democratic regimes. Moreover, in these countries, less appropriable resources extend the term in power (in line with the ruler incentive argument above), while more appropriable resources, such as diamonds, shorten political survival (perhaps, due to increased competition for power). Several papers show that in a bad institutional environment natural resources increase corruption (e.g., Bhattacharyya and Hodler (2010) or Vincente (2010)), and reduce corporate transparency (Durnev and Guriev (2011)).

Implications for Policy
Overall the literature points to potential economic as well as political problems connected to natural resources. Even if some issues remain contested it seems clear that many of the economic problems are solvable with appropriate policy measures and in general that natural resources can have positive effects on economic development given the right institutional setting. However, it seems equally clear that natural resource wealth, especially in initially weak institutional settings, tends to delay diversification and reforms, and also increases incentives to engage in various types of rent-seeking. In autocratic settings, resource incomes can also be used by the elite to strengthen their hold on power.
Successful examples of managing resource wealth, such as the establishment of sovereign wealth funds that can both reduce the volatility and create transparency and also smooth the use of resource incomes over time, are not always optimal or easily implementable. Using the money for large investments could be perfectly legitimate and consumption should be skewed toward the present in a capital-scarce developing setting (as shown by van der Ploeg and Venables, 2011). But no matter what we think we know about the optimal policy it still has to be implemented and if the institutional setting is weak the problems are very real. This is just because of potentially corrupt governments but also due to the difficulty to make credible commitments even for perfectly benevolent politicians (see e.g. Desai, Olofgård and Yousef, 2009).
Many political leaders in resource-rich countries have pointed to the hopelessness of their situation and have expressed a wish to rather be without their natural wealth. Such conclusions are unnecessarily pessimistic. Even if it is true that the policy implications from the literature more or less boil down to a catch-22 combination of 1) “Resources are bad (only) if you have poor institutions, so make sure you develop good institutions if you have resource wealth” and 2) “Natural resources have a tendency to impede good institutional development”, there are possibilities. Some countries have succeeded in using their resource wealth to develop and arguably strengthen their institutions. Even if it is often noted that Botswana had relatively good institutions already at the time of independence, it was still a poor country with no democratic history facing the challenge of developing a country more or less from scratch. And at the time of independence, they also discovered and started mining diamonds which have since been an important source both of growth and government revenue. This development has to a large part been due to good, prudent policy.
There is nothing inevitable about the adverse effects of natural resources but resource-rich developing countries must face the challenges that come with having such wealth and use it wisely. The first step is surely to understand the potential problems and to be explicit and transparent about how one intends to deal with them.
References
- Andersen, J. J. and Aslaksen, S., 2008. “Constitutions and the resource curse.” Journal of Development Economics, Volume 87, Issue 2.
- Andersen, J. J. and Aslaksen, S., 2011. “Oil and political survival.” mimeo.
- Andersen, J. J. and Ross, M., 2011, “Making the Resource Curse Disappear: A re-examination of Haber and Menaldo’s: “Do Natural Resources Fuel Authoritarianism?”.” mimeo.
- Aslaksen, S., 2010. “Oil and Democracy – More than a Cross-Country Correlation?,” Journal of Peace Research, vol. 47(4).
- Beck, T., and Laeven, L., 2006. “Institution Building and Growth in Transition Economies.” CEPR Discussion Paper 5718, Centre for Economic Policy Research:London.
- Bhattacharyya, S., and Hodler, R., 2010. “Natural resources, democracy and corruption” European Economic Review, Elsevier, vol. 54(4).
- Boschini, A.D., Pettersson, J. and Roine, J., 2007. “Resource curse or not: a question of appropriability” Scandinavian Journal of Economics, 109.
- Boschini, A.D., Pettersson, J. and Roine, J., 2011. “Unbundling the resource curse” mimeo.
- David, P. A., and Wright, G.. 1997. “The Genesis of American Resource Abundance” Industrial and Corporate Change 6.
- Desai, R. M., Olofsgård, A. and Yousef, T., 2009. “The Logic of Authoritarian Bargains” Economics & Politics, Vol. 21, Issue 1.
- Durnev, A. and Guriev, S. M., 2011. ”Expropriation Risk and Firm Growth: A Corporate Transparency Channel.”, mimeo
- Egorov, G., Guriev, S. M. and Sonin, K., 2009. “Why Resource-Poor Dictators Allow Freer Media: A Theory and Evidence from Panel Data.” American Political Science Review, Vol. 103, No. 4.
- Gylfason, T., 2001. “Nature, Power, and Growth” Scottish Journal of Political Economy, Scottish Economic Society, vol. 48(5).
- Gylfason, T., Herbertsson, T. T., and Zoega, G., 1999. “A mixed blessing” Macroeconomic Dynamics, 3.
- Findlay, R. and Lundahl M., 1999. “Resource-Led Growth: A Long-Term Perspective.” Helsinki: World Institute for Development Economics Research.
- Frankel, J. A., 2010 “The Natural Resource Curse: A Survey.” HKS Working Paper No. RWP10-005.
- Haber, S. H. and Menaldo, V. A., 2011. “Do Natural Resources Fuel Authoritarianism? A Reappraisal of the Resource Curse.” American Political Science Review, Vol. 105, No. 1.
- Harding, T. and Venables, A.J., 2011. “Exports, imports and foreign exchange windfalls.” mimeo.
- Hausmann R., Hwang J. and Rodrik, D., 2007. “What you export matters.” Journal of Economic Growth, Springer, vol. 12(1).
- Leite, C. A. and Weidmann, J., 1999. “Does Mother Nature Corrupt? Natural Resources, Corruption, and Economic Growth.” IMF Working Paper No. 99/85.
- Mehlum, H., Moene, K. and Torvik, R., 2006. ”Institutions and the resource curse.” Economic Journal, 116.
- Montague, D., 2002. “Stolen Goods: Coltan and Conflict in the Democratic Republic of Congo.” SAISReview – Volume 22, Number 1, Winter-Spring, pp. 103-118
- van der Ploeg, F., 2011. “Natural Resources: Curse or Blessing?.” Journal of Economic Literature, American Economic Association, vol. 49(2).
- van der Ploeg, F. and Venables, A. J., 2011. “Harnessing Windfall Revenues: Optimal Policies for Resource-Rich Developing Economies.” Economic Journal, Royal Economic Society, vol. 121(551).
- Ross, M.L., 2001. “Does Oil Hinder Democracy?” World Politics, 53(3).
- Sachs, J. D. and Warner, A. M., 1995. “Natural Resource Abundance and Economic Growth.” NBER Working Papers 5398, National Bureau of Economic Research, Inc.
- Sala-I-Martin, X., Doppelhofer, G. and Miller, R. I., 2004. “Determinants of Long-Term Growth: A Bayesian Averaging of Classical Estimates (BACE) Approach.” American Economic Review, American Economic Association, vol. 94(4).
- Sala-I-Martin, X., and Subramanian, A., 2003. “Addressing the Natural Resource Curse: An Illustration from Nigeria.” NBER Working Paper 9804.
- Stijns, J.-P., 2006. “Natural resource abundance and human capital accumulation.” World Development, Elsevier, vol. 34(6).
- Suslova, E. and Volchkova, N., 2007. “Human Capital, Industrial Growth and Resource Curse.” Working Papers WP13_2007_11, Laboratory for Macroeconomic Analysis, HSE.
- Torvik, R., 2009. “Why do some resource-abundant countries succeed while others do not?”, Oxford Review of Economic Policy, vol. 25(2).
- Tsui, K. K., 2011. “More Oil, Less Democracy: Evidence from Worldwide Crude Oil Discoveries.” The Economic Journal, 121.
- Vincente, P., 2010. “Does Oil Corrupt? Evidence from a Natural Experiment in West Africa,” Journal of Development Economics, 92(1).
- Wright, G., 1990. “The Origins of American Industrial Success, 1879-1940.” American Economic Review 80.
Footnotes
[1] Based on World Development Indicators database (World Bank).
[2] Its robustness has been confirmed in, for example, Gylfason, Herbertsson and Zoega (1999), Leite and Weidmann (1999), Sachs and Warner (2001) and Sala-i-Martin and Subramanian (2003). Doppelhoefer, Miller and Sala-i-Martin (2004) find that the negative relation between the fraction of primary exports in total exports and growth is one of 11 variables which is robust when estimates are constructed as weighted averages of basically every possible combination of included variables.
[3] The interested reader should consult more extensive overviews such as Torvik (2009), Frankel (2010) or van der Ploeg (2011).
[4] This assumption has been criticized by, for example, Wright (1990), David and Wright (1997), and Findlay and Lundahl (1999) who all point to historical examples where resource extraction has been a driver for the development of new technology. On the other hand others, e.g. Hausmann, Hwang and Rodrik (2007), provide evidence that export product sophistication predicts higher growth.
[5] The distinction between using institutional outcomes rather than institutional rules has been much debated in the literature on the importance of institutions in general. It is, for example, possible for a dictator to choose to enforce good property rights protection even if this is something typically associated with democracy.
[6] The studies by Boschini, Pettersson and Roine (2007) and (2011) also use instrumental variables to try to account for the potential endogeneity problems. The results are in line with the OLS results but instruments are weak in this setting.
Disclaimer: Opinions expressed in policy briefs and other publications are those of the authors; they do not necessarily reflect those of the FREE Network and its research institutes.
Whither Legal Turkey?

With the ascent to power of the AKP and its political victory against the secular elite and as the country is about to draft its first civilian constitution, the party’s leadership faces a daunting challenge to transform the country into a real democracy for minorities as well as majorities. The legacy of the party’s leadership will not be determined by its win against a system rigged against them, but how they transform an authoritarian and arbitrary legal system into extended rights for, amongst others, the country’s ethnic Kurds, women, and political rivals. This requires more than a new constitution and will be the real test of whether Turkey can serve as a model for the region or not.
A Sick Man No More
Turkey was once referred to as the ‘Sick Man of Europe’, plagued by financial turmoil, erratic growth, and territorial contraction. Today, it is among the twenty largest countries in the world both economically as well as population-wise, and remains one of few Muslim democracies. While Europe has been undergoing a financial crisis, Turkey has been growing at an unprecedented rate, leading the Economist to label it as ‘The China of Europe’.
Among the Arab countries, Turkey is also increasingly seen as a viable model of combining Islam and democracy, and many have lauded the government for its assertion of civilian control over state institutions. A recent triumphant tour of Egypt and Libya by Turkey’s Prime Minister blurred the distinction between official state visit and celebrity tour.
Yet Turkey’s leaders need all the political capital they can acquire, as steep challenges remain domestically. Whether Turkey can be a model for the rest of the Muslim world will be determined by whether its leadership can solve the remaining political and social injustices. Currently, these are exasperated by an outdated and authoritarian legal system and arbitrary enforcement of existing laws.
From White to Black
During the last two decades, Turkey has experienced something very rare. Historically, power emanated primarily from the country’s security establishment – the judiciary and the military – educated in the country’s elite schools and trained in a Kemalist creed where religious and non-Turkish identities had no place in the public sphere (that is, unless they were secular and Turkish). In the media, this group is often referred to as the ‘White Turks’.
The constitution set up in 1982, following a military coup two years earlier, put security and stability ahead of individual rights and cemented institutions with limited accountability to the public. The need to preserve the state’s security interests allowed for heavily regulated political participation among those deemed threatening to the state, be it Islamists, leftists, or those seeking increased Kurdish autonomy.
Weak coalition governments changed with the season, the debate captured by leaders powerful enough to hinder political rivals from affecting real policy while powerless or unwilling to do so themselves. Human rights abuses, especially in Eastern Turkey provided ample fuel for critics of Turkey’s prospects for EU membership.
Today, the ‘White Turks’ are nearly gone − a democratically elected majority government, made up largely of pious Muslims from the periphery of Turkey, is in power. The President, Abdullah Gül, is from Kayseri, the birthplace of the ‘Anatolian tigers’, a group of successful and piously Muslim entrepreneurs. The Prime Minister, Recep Tayyip Erdoğan, stems from (what was) one of the poorer neighborhoods in Istanbul, and spent time in jail for reciting what the judiciary deemed to be an inflammatory poem. Both men have wives wearing the headscarf, which for the secular elite is what a red rag is to a bull.
After a decade-long conflict between the moderately Islamist Justice and Development Party (AKP) and the secular elite, the former seems to have come out on top. Earlier this year the top brass of Turkey’s military corps resigned en masse following unprecedented arrests of senior military officers related to allegations of plotting a military coup. A constitutional amendment passed last year now allows military personnel, including those involved in the 1980 coup, to be tried in civilian courts and has revamped the appointment procedure of parts of the judiciary. A significant portion of all Turkish officers is currently in jail for conspiring against the AKP government.
With power consolidated behind them, the AKP leadership has their work cut out. While the Turkish model is already being lauded as a role model for the Arab spring countries, within the country significant challenges and injustices remain. Deep institutional reform is required to accommodate a people more than deserving of an open and free society. Full political and economic rights need to be further extended to women, religious minorities, as well as the country’s large Kurdish population. The justice system, especially the Turkish Penal Code needs to be altered to rid it of remnants of the authoritarian system that the AKP government claims to be dismantling. A new constitution is needed in which the state serves the people and not the other way around. Finally, Turkey needs more than new laws; it needs enforcement of, and compliance with, the rule of law in what would be an institutional change not seen since the birth of the republic.
In the name of terrorism…
In a recent survey of anti-terror convictions by the Associated Press in more than 100 countries, Turkey accounted for a third of all convictions. The Turkish state has long been at odds with a large Kurdish minority seeking greater autonomy and has been engaged in a war with the Kurdistan’s Worker’s Party (PKK) since the late 1980s.
The political system is currently rigged against Kurdish political representation, largely because of an extreme rule requiring any party to win at least 10 percent of the national vote to receive any parliamentary seats at all. Kurdish candidates not banned before elections regularly are afterwards and many end up in jail.
Despite the AKP’s attempt at a Kurdish Opening, and the sizeable Kurdish representation within the party, results have come up below expectations and large-scale protests remain commonplace in the region. Due to the Turkish Penal Code allowing anti-terror laws to govern the legal cases of protesters, this creates a source of regular condemnation from human rights organizations.
For example, not only can protesters sympathetic to Kurdish rights be prosecuted for spreading propaganda for a terrorist organization (Article 7/2, Anti-Terror Law), but also many are deemed to be “committing crimes on behalf of the PKK without being a member of that organization” (Article 220/6, Turkish Penal Codes). Consequently, demonstrators for Kurdish rights can be prosecuted as if they were actually fighting the government as armed members of the PKK (Article 314/2, TPC). When added to charges from the Law on Demonstrations and Public Assemblies, this could mean sentences of up to thirty years in jail. Child protesters usually receive much shorter sentences, often between four to five years.
Laws like these have profound effects on press freedom. According to a report by the Organisation for Security and Co-operation in Europe, Turkey has the dubious honor of being the world leader in imprisoned journalists. The report estimated somewhere between 700 and 1,000 ongoing proceedings that could lead to imprisonment of journalists. The length of sentences are occasionally astronomical; Vedat Kurşun and Emine Demir of the Azadiya Welat newspaper were sentenced to 166 and 138 years respectively in prison, while Bayram Namaz and Ibrahim Çiçek of the Atilim newspaper each face up to 3,000 years in prison. Some journalists, such as Halit Güdenoğlu of Halit Yürüyüş magazine, currently face 150 court cases.
At the same time, after 10 years of failing to reach convictions of leading members of the notorious Turkish Hizbullah, an Islamist militant group (unrelated to its Lebanese namesake), several of its leading members were released from custody earlier this year. The organization is thought to be responsible for the deaths of hundreds of people during the mid-1990s during the worst years of the conflict between the PKK and the Turkish state. Evidence suggesting covert state backing for the group’s fight and tactics against the PKK has not led to any serious consequences. The suspects were released in compliance with a new law restricting the amount of time suspects can be held while waiting for the final verdict in their cases to 10 years.
As if this was not ironic enough, the ten years of detainment without trial is now being used against the secular elite; officers, academics, journalists, former police chiefs, public prosecutors, and theologians alike. In two of the most controversial legal cases in Turkish history, around 500 individuals have been detained. Prosecutors in the Ergenekon investigation accuse detainees with membership of what is described as a clandestine terrorist organization seeking to destabilize the country’s Islamist-leaning government. In the Sledgehammer investigation, high-ranking members of the military stand accused of plotting a coup in 2003. Explained by the government as instrumental to the dismantling of the so-called “deep state”, the cases are increasingly criticized for the flawed, if not fabricated, evidence put forward by the prosecutors.
As noted by many observers, the detainees seem to have nothing in common except their opposition to the AKP government, as well as a social movement referred to as the Gülen movement. The actions of the prosecution approached that of a farce when earlier this year police raided the prospective publisher of a book about the the Gülen movement, written by detained journalist Ahmed Sik, and proceeded to delete every digital copy of the manuscript. The 12th Court for Serious Crimes described the draft as an “illegal organizational document” and ruled anyone refusing to hand in a possessed copy would be accused of “aiding a criminal organization.” Weeks later, seven theologians were arrested, and computers and documents were confiscated. The sole similarity between the theologians seems to have been their questioning of Gülen’s credentials as a theologian.
The independence of the judiciary is also under pressure. In 2007, a regional public prosecutor, Ilhan Cihaner, had started investigating links between Islamist organizations and the fixing of state contracts. After refusing to drop his investigations in late 2009 after pressure from the government, Cihaner was removed from his position and on February 17 2010 he was arrested and charged with membership of Ergenekon.
The Elephant in the Room: Women’s rights
Several of Turkey’s laws are also simply not enforced. Examples of this are laws regulating women’s rights. Despite a “Law 4320 on the Protection of the Family”, women’s de facto situation remains highly vulnerable – “enforcement officers, judges, and prosecutors neglect their duties, often due to lack of expertise or will to deal with cases of violence against women and girls”.
A recent survey by Hacettepe University reported that around 42 percent of all women older than 15 in Turkey—approximately eleven million women in total—have experienced physical or sexual violence at the hands of a husband or partner at some point in their lives.
Women who want to report abuse are turned away, and in some cases have been murdered despite having obtained protection orders. The law requires women’s shelters in every settlement above 50,000 inhabitants yet more than a hundred are still missing.
In the 2010 Gender Gap Report from the World Economic Forum, Turkey scored a rank of 126 out of 134 countries surveyed, behind its neighbors Iran, Syria, and Egypt. There are two main components that drove this abysmal performance in gender equality. The first is labor force participation; according to World Bank female labor force participation was a meager 24 percent in 2009 (on par with Saudi Arabia, Syria, and Egypt and below the rate found in Iran).
The second component is upper secondary education (high school), since this is where the combination of voluntary participation and the headscarf ban keeps many conservative families from sending their daughters to school. Almost a hundred years after Ataturk imposed a reform making primary education mandatory for women, gender inequality in education and labor remains one of the more serious impediments to Turkey’s future economic development.
The ban on the headscarf, especially in universities, a remnant of an increasingly archaic ideology, stands out as the unequivocal symbol of gender inequality. However, improving women’s rights and economic opportunities is about more than the headscarf – for example, making upper secondary education mandatory would be another less politically charged road ahead. But in order to further women’s participation in public institutions such as the labor force, education, and politics, political leaders need a pragmatic approach in outmaneuvering a deeper resistance to female emancipation.
Turkey needs more than a new constitution…
One of the AKP’s campaign promises of the recent June elections was the drafting of a new constitution. The political capital gained by the AKP in its fight with the military as well as its role as a model in the Muslim world, provides a unique opportunity to, for the first time, set up a civilian constitution that does away with many of the autocratic elements of the 1982 constitution.
A formal document with principals such as asserting the primacy of individual rights over the state is much needed. But without deeper reforms that seep into the justice system and the security establishment, this will simply become another superficial reform without real implications.
As long as the Turkish Penal Code and the anti-terror laws can be used in an arbitrary manner to pursue political opponents; be it Islamists, secular elites, or Kurds; constitutional reform will fail to bring about real change. Until real independence from political pressure is granted to judges and journalists alike, Turkey will not know freedom of expression. And without real change in female participation in markets and institutions, Turkey will not know gender equality. An age-old saying in Turkish goes “Happy is he who can call himself a Turk.” If only it was that easy.
▪
Further Reading
- Acemoglu, Daron, Simon Johnson, and James Robinson, 2005, “Institutions as the Fundamental Cause of Long-Run Growth”, Handbook of Economic Growth, Elsevier, edition 1, Vol. 1, No. 1.
- Duflo, Esther, 2005, “Gender Equality in Development”, BREAD Policy Paper.
- Jenkins, Gareth, 2009, “Between Fact and Fantasy: Turkey’s Ergenekon Investigation”, Silk Road Paper
- Hacettepe University Institute of Population Studies, ICON-Institute Public Sector GmbH, and BNB Consulting, “National Research on Domestic Violence against Women in Turkey 2008”, January 2009, http://www.ksgm.gov.tr//tdvaw/doc/Mainreport.pdf
- Human Rights Watch, “Protesting as a Terrorist Offense – The Arbitrary Use of Terrorism Laws to Prosecute and Incarcerate Demonstrators in Turkey”, Human Rights Watch Report, November 1st 2010, http://www.hrw.org/reports/2010/11/01/protesting-terrorist-offense-0
- Human Rights Watch, “He Loves You, He Beats You – Family Violence in Turkey and Access to Protection”, Human Rights Watch Report, May 4 2011, http://www.hrw.org/en/reports/2011/05/04/he-loves-you-he-beats-you-0
- World Economic Forum, The Gender Gap Report 2010, http://www3.weforum.org/docs/WEF_GenderGap_Report_2010.pdf
What Do Recent Insights From Development Economics Tell Us About Foreign Aid Policy?

The short answer is: quite a lot, but different parts of the literature offer different recommendations. The problem is that these different recommendations are partly in conflict, and that political and bureaucratic incentives may reinforce these frictions when putting aid policy into practice. It follows that reforms aiming at improving aid effectiveness have to find a way to deal with this conflict and also balance the tendency of institutional sclerosis within bureaucratic agencies against short sighted incentives of politicians.
The currently predominant field of development economics focuses on impact evaluation of different economic and social interventions. These studies are all micro-oriented, looking at the impact on the level of the individual or household, rather than at the nation as a whole. One example is evaluations of the effects of different interventions on school participation, such as conditional cash transfers, free school meals, provision of uniforms and textbooks, and de-worming. Other well-known studies have looked at educational output, moral hazard versus adverse selection on financial markets, how to best allocate bed-nets to prevent malaria, and the role of information in public goods provision and health outcomes.
What has sparked the academic interest in these types of impact evaluations is the application of a methodology well known from clinical trials and first introduced in the field of economics by labor economists, randomized field experiments. The purpose of impact evaluation is to establish the causal effect of the program at hand. Strictly speaking this requires an answer to the counterfactual question; what difference does it make for the average individual if he is part of the program or not. Since an individual cannot be both part of, and not part of, the program at the same time, an exact answer to that question cannot be reached. Instead evaluators must rely on a comparison between individuals participating in the program and those that do not, or a before and after comparison of program participants. The challenge when doing this is to avoid getting the comparison contaminated by unobservable confounding factors and selection issues. For instance, maybe only the most school motivated households are willing to sign up for conditional cash transfer programs, so a positive correlation between program involvement and school participation may all be due to a selection bias (these households would have sent their children to school anyway). In this case participation is what economists refer to as “endogenous”, individual characteristics that may impact the outcome variable may also drive participation in the program.
To get around this problem, the evaluator would want strictly “exogenous” variation in the participation in the program, i.e. individuals should not get an opportunity to self-select into participation or not. The solution to this problem is to select a group of similar individuals/households/villages and then randomize participation across these units. This creates a group of participants in the program (the “treated”, using the language of clinical studies) and a group of non-participants (the “control group”) who are not only similar in all observable aspects thought to possibly affect the outcome, but who are also not given the opportunity to self-select into the program based on unobservable characteristics. Based on this methodology, the evaluator can then estimate the causal effect of the program. Exactly how that is done varies, but in the cleanest cases simply by comparing the average outcome in the group of treated with that in the group of controls.
So what has this got to do with aid policy? A significant part of aid financing goes of course to projects to increase school participation, give the poor access to financial markets, eradicate infectious diseases, etc. Both the programs evaluated by randomization, and the randomization evaluations themselves, are often financed by aid money. The promise of the randomization literature is thus that it offers a more precise instrument to evaluate the effectiveness and efficiency of aid financed projects, and also helps aid agencies in their choice of new projects by creating a more accurate knowledge bank of what constitutes current best practices. This can be particularly helpful since aid agencies often are under fire for not being able to show what results their often generous expenditures generate. Anyone who has followed the recent aid debate in Sweden is familiar with this critique, and the methodology of randomization is often brought forward as a useful tool to help estimate and make public the impact of aid financed development projects.
Limits to Randomization
Taken to the extreme, the “randomization revolution” suggests that to maximize aid effectiveness all aid should be allocated to clearly defined projects, and only to those projects that have been shown through randomization to have had a cost-effective causal effect on some outcome included in the aid donors objective (such as the millennium development goals). Yet, most aid practitioners would be reluctant to ascribe to such a statement. Why is that? Well, as is typically the case there are many potential answers. The cynic would argue that proponents of aid are worried that a true revelation of its dismal effects would decrease its political support, and that aid agencies want to keep their relative independence to favor their own pet projects. Better evaluation techniques makes it easier for politicians and tax payers to hold aid agencies accountable to their actions, and principal-agency theory suggests that governments then should put more pressure on agencies to produce verifiable results.
There are other more benevolent reasons to be skeptical to this approach, though, and these reasons find support in the more macro oriented part of the literature. In recent papers studying cross national differences in economic growth and development almost all focus is on the role of economic and political institutions. The term “institutions” has become a bit of a catch-phrase, and it sometimes means quite different things in different papers. Typically, though, the focus lies on formal institutions or societal norms that support a competitive and open market economy and a political system with limited corruption, predictability and public legitimacy. Critical components include protection of property rights, democracy, honest and competent courts, and competition policy, but the list can be made much longer. Also this time the recent academic interest has been spurred by methodological developments that have permitted researchers to better establish a causal effect from institutions to economic development. Estimating cleanly the effect of institutions on the level or growth rate of GDP is complicated since causality is likely to run in both directions, and other variables, such as education, may cause both. What scholars have done is to identify historical data that correlates strongly with historic institutions and then correlated the variation in current institutions that can be explained by these historical data with current day income levels. If cross national variation in current institutions maps closely to cross national variation in historical institutions (“institutional stickiness”) and if current day income levels, or education rates, do not cause historical institutions (which seems reasonable) then the historical data can be used as a so called “instrument” to produce a cleaner estimate of the causal effect of institutions.
Note that randomization and instrumentation are trying to solve the same empirical challenge. When randomization is possible it will be superior if implemented correctly (because perfect instruments only exist in theory), but there is of course a fairly limited range of questions for which randomized experiments are possible to design. In other cases scholars will have to do with instrumentation, or other alternatives such as matching, regression discontinuity or difference-in-difference estimations to better estimate a causal effect.
A second insight from this literature is that what constitutes successful institutions is context specific. Certain economic principles may be universal; incentives work, competition fosters efficiency and property rights are crucial for investments. However, as the example of China shows, what institutions are most likely to guarantee property rights, competition and the right incentives may vary depending on norms and historical experiences among other things. Successful institutional reforms therefore require a certain degree of experimentation for policy makers to find out what works in the context at hand. To just implement blueprints of institutions that have worked elsewhere typically doesn’t work. In other words, institutions must be legitimate in the society at hand to have the desired effect on individual behavior.
Coming back to aid policy, the lesson from this part of the literature is that for aid to contribute to economic and social development, focus should be on helping partner country governments and civic society to develop strong economic and political institutions. And since blueprints don’t work, it is crucial that this process involves domestic involvement and leadership in order to guarantee that the institutions put in place are adapted to the context of the partner country at hand, and has legitimacy in the eyes of both citizens and decision makers. Indeed, institution building is also a central part of aid policy. This sometimes takes an explicit form such as in financing western consultants with expertise in say central banking reform or how to set up a well-functioning court system. But many times it is also implicit in the way the money is disbursed, through program support rather than project support (where the former is more open for the partner country to use at their own priorities), through the partner country’s financial management systems and recorded in the recipient country budget. Also in the implementation of projects there is an element of institution building. By establishing projects within partner government agencies and actively involving its employees, learning and experience will contribute to institutional development.
Actual aid policy often falls short of these ambitions, though. Nancy Birdsall has referred to the impatience with institution building as one of the donors’ “seven deadly sins”. The impatience to produce results leads to insufficient resources towards the challenging and long term work of creating institutions in weak states, and the search for success leads to the creation of development management structures (project implementation units) outside partner country agencies. The latter not only generates no positive spill-overs of knowledge within government agencies, but can often have the opposite effect when donors eager to succeed lure over scarce talent from government agencies. The aid community is aware of these problems and has committed to improve its practices in the Paris declaration and the Accra Agenda, but so far progress has been deemed as slow.
Micro or Macro?
So, I started out saying that there is a risk that these two lessons from the literature may be in conflict if put into practice for actual aid policy. Why is that? At a trivial level, there is of course a conflict over the allocation of aid resources if we interpret the lessons as though the sole focus should be on either institutional development or best practice social projects respectively. However, most people would probably agree that there is a merit to both. In theory it is possible to conceive of an optimal allocation of aid across institutional support and social project support, in which the share of resources going to project support is allocated across projects based on best practices learned from randomized impact evaluations. In practice, however, it’s important to consider why these lessons from the literature haven’t been implemented to a greater extent already. After all, these are not completely new insights. Political economy and the logic of large bureaucratic organizations may be part of the answer. Once these factors are considered, a less trivial conflict becomes apparent, showing the need to think carefully about how to best proceed with improving the practices of aid agencies.
As mentioned above, one line of criticism against aid agencies is that they have had such a hard time to show results from their activities. This is partly due to the complicated nature of aid in itself, but critics also argue that it is greatly driven by current practices of aid agencies. First of all there is a lack of transparency; information about what decisions are made (and why), and where the money is going is often insufficient. This problem sometimes becomes acute, when corruption scandals reveal the lack of proper oversight. Secondly, money is often spent on projects/programs for which objectives are unclear, targets unspecified, and where the final impact of the intervention on the identified beneficiaries simply can’t be quantified. This of course limits the ability to hold agencies accountable to their actions, so focus instead tends to fall on output targets (have all the money been disbursed, have all the schools been built) rather than the actual effects of the spending. So why is this? According to critics, a reason for this lack of transparency and accountability is that it yields the agencies more discretion in how to spend the money. Agencies are accused of institutional inertia, programs and projects keep getting financed despite doubts about their effectiveness because agency staff and aid contractors are financially and emotionally attached.
In this context, more focus on long run, hard to evaluate institutional development may be taken as an excuse for continuing business as usual. Patience, a long run perspective and partner country ownership is necessary, but it cannot be taken as an excuse for not clearly specifying verifiable objectives and targets, and to engage in impact evaluation. It is also important that a long term commitment doesn’t have to imply an unwillingness to abandon a program if it doesn’t generate the anticipated results. It is of course typically much harder to design randomized experiments to evaluate institutional development than the effect of say free distribution of bed-nets. But it doesn’t follow that it is always impossible, and, more importantly, it doesn’t preclude other well founded methods of impact evaluation. The concern here is thus that too much emphasis on the role of institutional development is used as an excuse for not incorporating the main lesson from the “randomization revolution”, the importance of the best possible impact evaluation, because actual randomization is not feasible.
The concern discussed above is based on the implicit argument that aid agencies due to the logic of incentives and interests within bureaucratic institutions may not always do what is in their power to promote development, and that this is made possible through lack of transparency and accountability. The solution would in that case seem to be to increase accountability of aid agencies towards their politicians, the representatives of the tax payers financing the aid budget. That is, greater political control of aid policy would improve the situation.
Unfortunately, things aren’t quite that easy, which brings us to the concern with letting the ability to evaluate projects with randomized experiments being a prerequisite for aid financing. We have already touched upon the problem that programs for institutional development are hard to design as randomized experiments. It follows that important programs may not be implemented at all, and that aid allocation becomes driven by what is feasible to evaluate rather than by what is important for long run development. But there is also an additional concern that has to do with the political incentives of aid. The impatience with institution building is often blamed on political incentives to generate verifiable success stories. This is driven by the need to motivate aid, and the government policies more generally, in the eyes of the voters. It follows that politicians in power often have a rather short time horizon, that doesn’t square well with the tedious and long run process of institution building. Putting aid agencies under tighter control of elected politicians may therefore possibly solve the problem outlined above, but it may also introduce, or reinforce, another problem, the impatience with institution building.
Unfortunately, the perception that randomization makes it possible to more exactly define what works and what doesn’t, may have further unintended consequences if politicians care more about short term success than long term development. We know from principal-agent theory that the optimal contract gives the agent stronger incentives to take actions that contribute to a project if it becomes easier to evaluate whether the project has been successful or not. Think now of the government as the principal and the aid agency as the agent, and consider the case when the government has a bias towards generating short run success stories. In this case the introduction of a new technology that makes it easier to evaluate social projects (i.e. randomization) will make the government put stronger incentives on the aid agency to redirect resources towards social projects and away from institutional development. This would not be a problem if the government had development as its only objective, because then the negative consequences on effort at institution building would be internalized in the incentive structure. But in a second best world where politics trump policy, the improved technology may have perverse and unintended consequences. Greater political control will lead to less focus on institutional development than what is desired from a development perspective. A very benevolent (naïve?) interpretation of the motivation behind aid agencies’ tendencies to design social projects such that their effects are hard to quantify could thus be that it decreases the political pressure to ignore institutional development.
Concluding Remarks
The challenge to heed the two lessons from the literature thus goes beyond the mere conflict of whether to allocate the resources to institutional development or to best practice social projects once political economy and bureaucratic incentives are considered. Improved agency accountability may be necessary to avoid “institutional sclerosis” in the name of institution building and make sure that best practices are followed, but too much political meddling may lead to short sightedness and a hunt for marketable success stories. It is even possible, that the “randomization revolution” may make matters worse, if it becomes an excuse for neglecting the tedious and long term process of institution building and reinforces the political pressure for short term verifiable results.
What is then the best hope for avoiding this conflict of interest? That is far from a trivial question, but maybe the best way to make sure that agency accountability towards their political principals doesn’t lead to impatience with institution building is to form a broad-based political consensus around the objectives, means and expectations of development aid. The pedagogical challenge to convince tax payers that aid helps and that they need to be patient remains, but at least the political temptation to accuse political opponents of squandering tax payers money without proven effects and to pretend to have the final solution for how to make aid work, should be mitigated. But until then the best bet is probably to stay skeptical to anyone claiming to have the final cure for aid inefficiency, and to allow some trust in the ability of experienced practitioners to do the right thing.
Recommended Further Reading
- Acemoglu, D., S. Johnson and J.A. Robinson (2001) “The Colonial Origins of Comparative Development: An Empirical Investigation“, American Economic Review 91(5), 1369-1401.
- Banerjee, A. (Ed.) (2007), “Making Aid Work”, MIT Press.
- Bannerjee, A. and E. Duflo (2008), “The Experimental Approach to Development Economics”, NBER Working Paper 14467.
- Birdsall, N. (2005), “Seven Deadly Sins: Reflections on Donor Failings”, CGD Working Paper 50.
- Birdsall, N. and H. Kharas (2010), “Quality of Official Development Assistance Assessment”, Working Paper, Brookings and CGD.
- Duflo, E., R. Glennerster and M. Kremer (2007), “Using Randomization in Development Economics Research: A Toolkit”, CEPR Discussion Paper 6059.
- Easterly, W. (2002), “The Cartel of Good Intentions: The problem of Bureaucracy in Foreign Aid”, Journal of Economic Policy Reform, 5, 223-50.
- Easterly, W. and T. Pfutze (2008), “Where Does the Money Go? Best and Worst Practices in Foreign Aid”, Journal of Economic Perspectives, 22, 29-52.
- Knack, S. and A. Rahman (2007), “Donor fragmentation and bureaucratic quality in aid recipients”, Journal of Development Economics, 83(1), 176-97.
- Rodrik, D. (2008), “The New Development Economics: We Shall Experiment, but how Shall We Learn?”, JFK School of Government Working Paper 55.
Disclaimer: Opinions expressed in policy briefs and other publications are those of the authors; they do not necessarily reflect those of the FREE Network and its research institutes.
Baltic Shadow Economies

This policy brief summarises the results and implications of a recent study of the size and determinants of the shadow economies in Estonia, Latvia, and Lithuania. The results suggest that the shadow economy in Latvia in 2010 is considerably larger than in neighboring Estonia and Lithuania. While the shadow economy as a percentage of GDP in Estonia contracted from 2009 to 2010, it expanded in Latvia and Lithuania. An important driver of shadow activity in the Baltic countries is the entrepreneurs’ dissatisfaction and distrust in the government and the tax system. Involvement in the shadow economy is more pervasive among younger firms and firms in the construction sector. These findings have a number of policy implications, which are discussed at the end of this brief.
Background and Aims
Anecdotal evidence suggests that the shadow economies in the Baltic countries and other emerging Central and Eastern European countries are substantial in size relative to GDP. This is an important issue for these countries because informal production has a number of negative consequences.
First, countries can spiral into a ‘bad equilibrium’: individuals go underground to escape taxes and social welfare contributions, eroding the tax and social security bases, causing increases in tax rates and/or budget deficits, pushing more production underground and ultimately weakening the economic and social basis for collective arrangements. Second, tax evasion can also hamper economic growth by diverting resources from productive uses (producing useful goods and services) to unproductive ones (mechanisms and schemes to conceal income, monitoring of tax compliance, issuance and collection of penalties for non-compliance). Third, informal production can constrain entrepreneurs’ ability to obtain debt or equity financing for productive investment because potential creditors/investors cannot verify the true (concealed) cash flows of the entrepreneur. This can further impede growth. Finally, shadow activities distort official statistics such as GDP, which are important signals to policy makers.
The aim of our study is to measure the size of the shadow economies in Estonia, Latvia, and Lithuania, and to analyse the factors that influence participation in the shadow sector. We use the term ‘shadow economy’ to refer to all legal production of goods and services that is deliberately concealed from public authorities. The study also makes a methodological contribution by developing an index of the size of the shadow economies as a percentage of GDP. It is foreseen that the index will be published regularly.
Although an index invites comparisons, and maybe even ‘competitions’ between countries, the purpose here is not to create a ‘Baltic championship’ on shadow economies. The index should primarily be seen as a tool to promote discussion on the size and role of the shadow economy and to provide a metric which can be used to measure the degree of success in fighting the shadow economy.
Method of Measuring the Shadow Economies
Estimates the size of the shadow economies are derived from surveys of a stratified random sample of entrepreneurs in the three countries (591 in Latvia, 536 in Lithuania and 500 in Estonia). The rationale for this approach is that those most likely to know how much production or income goes unreported, are the entrepreneurs who themselves engage in the misreporting and shadow production.
Survey-based approaches face the risk of underestimating the total size of the shadow economy due to non-response and untruthful response given the sensitive nature of the topic. We minimise this risk by employing a number of surveying and data collection techniques shown in previous studies to be effective in eliciting more truthful responses (e.g., Gerxhani, 2007; Kazemier and van Eck, 1992; Hanousek and Palda, 2004).
These approaches include framing the survey as a study of satisfaction with government policy, gradually introducing the most sensitive questions after less sensitive questions, phrasing misreporting questions indirectly, e.g., asking entrepreneurs about the shadow activity among ‘firms in their industry’ rather than ‘their firm’, and, in the analysis, controlling for factors that correlate with potential untruthful response, such as tolerance towards misreporting. We aggregate entrepreneurs’ responses about misreported business income, unregistered or hidden employees, as well as unreported ‘envelope’ wages to obtain estimates of the shadow economies as a proportion of GDP.
There are three common methods of measuring GDP: the output, expenditure and income approaches. Our index is based on the income approach, which calculates GDP as the sum of gross remuneration of employees (gross personal income) and gross operating income of firms (gross corporate income). Computation of the index proceeds in three steps: (i) estimate the extent of underreporting of employee remuneration and underreporting of firms’ operating income using the survey responses; (ii) estimate each firm’s shadow production proportion as a weighted average of the two underreporting estimates with the weights reflecting the proportions of employee remuneration and firms’ operating income in the composition of GDP; and (iii) calculate a production-weighted average of shadow production across firms. Taking weighted averages of the underreporting measures rather than a simple average is important for the shadow economy index to reflect a proportion of GDP.
Size of the Shadow Economies
Table 1 indicates that the shadow economy as a proportion of GDP is considerably larger in Latvia (38.1%) compared to Estonia (19.4%) and Lithuania (18.8%) in 2010. Only Estonia has managed to marginally decrease the proportional size of its shadow economy from 2009 to 2010 – a statistically significant decrease of 0.8 percentage points. In contrast, the proportional size of the shadow economies in Lithuania and Latvia has increased by an estimated 0.8 and 1.5 percentage points, respectively.
Table 1. Shadow economy index for the Baltic countries

Note: This table reports point estimates and 95% confidence intervals for the size of the shadow economies as a proportion of GDP. The third column reports the change in the relative size of the shadow economies from 2009 to 2010.
Form of Shadow Activity
Figure 1 illustrates the average levels of underreporting (business profits, number of employees and salaries) in each of the countries in 2009 and 2010. The average levels of underreporting in all three areas are in the order of two to three times higher in Latvia compared to Lithuania and Estonia. In Latvia and Lithuania, the degree of underreporting of business profits and salaries (‘envelope’ wages) is approximately twice as large as the underreporting of employees. The exception to this trend is the relatively low amount of underreported business profits in Estonia, likely to be a result of low corporate tax rates. Bribery in Latvia and Lithuania constitutes a similar fraction of firms’ revenue, approximately 10%, whereas in Estonia bribery is less pervasive and constitutes around 6% of firms’ revenue.
Figure 1. Simple averages of underreporting and bribery among Estonian (EE), Lithuanian (LT) and Latvian (LV) firms in 2009 and 2010.

Determinants of Involvement in the Shadow Economy
The literature on tax evasion identifies two main groups of factors that affect the decision to evade taxes and thus participate in the shadow economy. The first set emerges from rational choice models of the decision to evade taxes. In such models individuals or firms weigh up the benefits of evasion in the form of tax savings against the probability of being caught and the penalties that they expect to receive if caught. Therefore the decision to underreport income and participate in the shadow economy is affected by the detection rates, the size and type of penalties, firms’ attitudes towards risk-taking and so on. These factors are likely to differ across countries, regions, sectors of the economy, size and age of firm, and entrepreneurial orientation (innovativeness, risk-taking tendencies, and pro-activeness).
Empirical studies find that the actual amount of tax evasion is considerably lower than predicted by rational choice models based on pure economic self-interest. The difference is often attributed to the second, broader, set of tax evasion determinants – attitudes and social norms. These factors include perceived justice of the tax system, i.e., attitudes about whether the tax burden and administration of the tax system are fair. They also include attitudes about how appropriately taxes are spent and how much firms trust the government. Finally, tax evasion is also influenced by social norms such as ethical values and moral convictions, as well as fear of feelings of guilt and social stigmatisation if caught.
Our study uses regression analysis to identify the factors that are statistically related to firms’ involvement in the shadow economy. The results indicate that the size of the shadow economy is smaller in Estonia and Lithuania relative to Latvia, after controlling for a range of factors.
Tolerance towards tax evasion is positively associated with the firm’s stated level of income/wage underreporting. Satisfaction with the tax system and the government is negatively associated with the firm’s involvement in the shadow economy, i.e. dissatisfied firms engage in more shadow activity, satisfied firms engage in less.
This result is consistent with previous research on tax evasion, and offers an explanation of why the size of the shadow economy is larger in Latvia than in Estonia and Lithuania; namely that Latvian firms engage in more shadow activity because they are more dissatisfied with the tax system and the government as illustrated in Figure 2. Analysing each of the four measures of satisfaction separately we find that shadow activity is most strongly related to dissatisfaction with business legislation, followed by the State Revenue Service, the government’s tax policy, and finally the government’s support for entrepreneurs.
Figure 2. Average satisfaction of firms with the tax system and government in 2010.

Note: These questions use a 5-point scale: 1=“very unsatisfied”; 2=“unsatisfied”; 3=“neither satisfied nor unsatisfied”; 4=“satisfied”; and 5=“very satisfied”. SRS is State Revenue Service.
Another strong determinant of involvement in the shadow economy is firm age, with younger firms engaging in more shadow activity than older firms. This effect dominates relations between firm size and shadow activity. A possible explanation for the relation is that young firms entering a market made up of established competitors use tax evasion as a means of being competitive in their early stages. The regression results also provide some evidence that after controlling for other factors, firms in the construction sector and firms that have a pro-active entrepreneurial orientation tend to engage in more shadow activity.
Policy Implications
First, the relatively large size of the shadow economies in the Baltic countries, and their different expansion/contraction trends, cause significant error in official estimates of GDP and its rates of change, because although statistics bureaus in each of the countries attempt to include some of the shadow production in GDP estimates they do not capture the full extent. Not only is GDP used in key policy ratios such as government deficit to GDP, debt to GDP, but also the rate of change is used as a key indicator of economic performance and therefore guides policy decisions. When the shadow economy is expanding (as in Latvia and Lithuania) official GDP growth rates underestimate true economic growth and when the shadow economy is contracting (as in Estonia) official GDP growth rates overstate true economic growth. At a minimum, policy makers need to be aware of these biases in official statistics, but ideally, statistical bureaus would implement more rigorous methods to estimate and incorporate shadow production in official statistics.
Second, our results suggest that to reduce the size of the shadow economies in the Baltic countries by encouraging voluntary compliance, a key factor that needs to be addressed is the high level of dissatisfaction with the tax system and with the government. Addressing this issue could involve actions such as making tax policy more stable (less frequent changes in procedures and tax rates), and increasing the transparency with which taxes are spent.
Finally, our estimates of the size of the shadow economies suggest that there is significant scope for all three governments to increase their revenues by bringing production ‘out of the shadows’. Investment in programs aimed at reducing the size of the shadow economies could be rather profitable for the Baltic governments, because even a small influence on entrepreneurial behaviour could result in significant revenue increases.
References
- Gerxhani, K. (2007) “‘Did you pay your taxes?’ How (not) to conduct tax evasion surveys in transition countries”, Social Indicators Research 80, pp. 555-581.
- Hanousek, J., and F. Palda (2004) “Quality of government services and the civic duty to pay taxes in the Czech and Slovak Republics, and other transition countries”, Kyklos 57(2), pp.237-252.
- Kazemier, B., and R. van Eck (1992) “Survey investigations of the hidden economy”, Journal of Economic Psychology 13, pp. 569-587.
- Schneider, F., A. Buehn, and C.E. Montenegro (2010) “Shadow economies all over the world: New estimates for 162 countries from 1999 to 2007”, World Bank Policy Research Working Paper 5356.
Disclaimer: Opinions expressed in policy briefs and other publications are those of the authors; they do not necessarily reflect those of the FREE Network and its research institutes.
Do Russians Oppose Anti-Tobacco Policy?

Russia is known as a persistent leader in terms of high adult mortality rates among the middle-income countries. Unhealthy lifestyle, smoking and excessive alcohol consumption have been confirmed as major causes of the high mortality rates in Russia. Each of these causes are estimated to cost about 10 years of life. While alcoholism receives some attention in public debate (though not that much in policy decisions), the dangers of smoking are often downplayed. This is in a country where 60% of males and 22% of females smoke, cigarettes are very cheap (about 60 euro cents per pack), and smoking prevalence among teenagers is very high: almost 25% of those in the 15-18 age group smoke.
The tobacco industry lobby has used the threat of potential protests by the Russian public as an argument against policies to fight smoking. The New Economic School and Quirk Global Strategies conducted a survey of 1200 adults in December 2010 in order to gauge attitudes of the Russian public towards a national policy for reducing tobacco use. The fieldwork was conducted by Moscow-based ROMIR in 93 urban and rural settlements across the country.
Russians believe that smoking is harmful and that tobacco use is a serious problem
The vast majority of Russians (95%) believe that smoking cigarettes are harmful (72%, including a majority of smokers, say that it is very harmful) . In addition, nearly seven out of ten Russians think that smoking and tobacco use is a “very serious” problem in the country.

Figure 1. Attitudes towards a national policy to reduce tobacco use.
Eight in ten Russians (80%) support a national tobacco control policy to help reduce tobacco use in the country (see Figure 1). The policy has support across Russia’s demographic and geographic spectrum. Even nearly two-thirds of regular smokers (63%) support a national policy to help reduce tobacco use. Overall, just 14% of Russians oppose the idea.
Increasing the price of tobacco products and tobacco taxes
Most Russians believe that the price of a pack of cigarettes is either about right (40%) or too low (31%). Very few (16%) think that the price of cigarettes is too high. Even among regular smokers, just 20% view the current cost of cigarettes as too high, which is nearly identical to the number of regular smokers who think that cigarettes are too cheap (19%).
There is support for the idea of increasing the price of tobacco products, including raising tax on tobacco, as part of an effort to reduce tobacco use in the country (Figure 2). It was found that 70% of Russians support price increases, and 41% strongly support such increases. The share of respondents who oppose increasing the price of tobacco products is 27%, and very few (7%) are in strong opposition.

Figure 2. Attitudes towards a price increase.
There is majority support for higher prices for cigarettes in every region of the country, although the level of support varies. The strongest level is in the Southern region (82%), while the Volga (61%) and Ural regions (66%) are less supportive. A slight majority of regular smokers opposes raising prices for cigarettes (51% against 47% in favor), including tobacco tax increases. However, nearly two-thirds (65%) of the occasional smokers, support the idea.
A majority (54%) of Russians believe that smoking rates will stay the same and 24% believe that smoking rates will decrease after the modest tax increase announced by the Russian Ministry of Health goes into effect. However, a plurality (44%) believes that smoking rates would decrease if cigarette prices tripled to approximately 75-100 rubles per pack.
If the Russian Government did decide to increase the price of tobacco products to approximately 75-100 rubles per pack, fewer than one in ten Russians (9%) would be very displeased (a total of 28% indicate that they would be displeased). Indeed, a plurality (38%) of Russians would be pleased with such a significant price increase for cigarettes and another 27% would be apathetic.
Russians support other specific policies to reduce tobacco use
Strong majorities in Russia favor other specific policies to help address tobacco use in the country. These policies include a ban on tobacco advertising (86%), funding tobacco prevention programs (85%), stronger health warnings on cigarette packs (81%), and prohibiting smoking entirely in public places and workplaces, including restaurants and bars (82%).
The latter result is reinforced by the finding that 72% of Russians view the rights of customers and employees to breathe clean air in restaurants and bars as more important than the rights of smokers to smoke and business owners to allow smoking (see Figure 3). Even 53% of regular smokers think the same. It was found that 24% of Russians consider the rights of smokers to smoke and business owners to allow smoking in restaurants and bars as more important.

Figure 3. Attitudes towards the right to breathe clean air and the right to smoke in restaurants and bars.
To sum up, the vast majority of Russians think that tobacco use is a serious problem in the country. Accordingly, there is a high level of support for a national policy to reduce tobacco use in Russia. In addition, there is support for the idea of increasing the price of tobacco products, including raising tax on tobacco, as part of an effort to reduce tobacco use in the country.
Disclaimer: Opinions expressed in policy briefs and other publications are those of the authors; they do not necessarily reflect those of the FREE Network and its research institutes.
Incomes of Polish Households in the Context of 2005-2011 Tax and Benefit Reforms: A Pre-Election Analysis

On October 9, Polish voters will decide who will form the new government. In an analysis of tax and benefit reforms introduced over the last two terms of Parliament, the independent Centre for Economic Analysis, CenEA, examines who gained and who lost on the implemented changes. The reforms that have been implemented since 2006 include significant tax reductions and important changes to family benefits, as well as a recent increase in the VAT. In the context of declarations made in earlier electoral campaigns, the actually implemented economic policies introduced, offer little guidance to the voters regarding the reliability of promises made during this current campaign.
The last two terms of office for the Polish parliament includes the period October 2005 till November 2007, and the current four-year term which followed a snap-election in 2007, and which will now come to an end with parliamentary elections scheduled for October 9.
During 2005-2007, the ruling coalition was led by the Law and Justice party (PiS) who then lost the 2007 elections to the Civic Platform (PO). This year, these two parties remain the main contenders for electoral victory.
The years since 2005 have been marked by a series of significant reforms with substantial influence on disposable incomes of Polish households. These reforms are analyzed in the first Pre-election Report recently published by the independent Centre for Economic Analysis, CenEA (Myck et al., 2011). This report analyses the extent of the most important economic reforms undertaken in the last two terms of office and their distributional consequences. The analysis is done using the Polish microsimulation model SIMPL based on a dataset from the Polish Household Budgets’ Survey.
The report considers the following economic reforms:
- reductions in disability rates of social security contributions (SSC) in 2007 and 2008,
- introduction of a generous child tax credit (CTC) in the personal income tax system in 2007,
- introduction of a two-rate (18% and 32%) instead of a three-rate (19%, 30%, 40%) system of personal taxation (PIT reform) in 2009,
- a series of reforms to the means-tested system of family benefits (FB) in 2006 and 2009,
- a VAT reform which increased the basic rate from 22% to 23% and changed the operation of lower rates at 5% and 8% instead of 3% and 7%.

Source: based on Myck et al. (2011), Table 4.
Annual values are given in Euros; differences in SSCs are computed as net changes accounting for changes in the public sector’s employer contributions. Exchange rate: 1 Euro = 4.3595 PLN.
While the big reforms grabbed the headlines, subsequent governments which oversaw their implementation, followed the policy of raising taxes and lowering expenditures through policies of freezing the value of tax credits and eligibility thresholds for family benefits. In the latter case, this generated a reduction in the number of children eligible to family benefits by 18%. At the same time, the value of benefits to those receiving them increased, on average, by 60%, with the net effect being a 7% increase in family benefit spending.
It is shown in our report that the reform package implemented in the 5th term of Parliament, and which included, in particular, the SSC reforms (2007/08), the CTC (2007), and a reform of the FB system (2006), has been distributed very evenly across different income groups. Households in income deciles 1-9 saw their incomes grow by about 4.5%, while those in the top decile gained about 3%. The implementation of the tax reform in 2009 brought about significant gains only to high income households. This tax reform was legislated prior to the financial crisis in 2008. The policy of freezing tax credits and benefit-eligibility thresholds, introduced in 2008 and 2011, resulted in losses for middle-income groups but meant that the bottom decile gained about 1%. This was largely through changes in the value of family benefits for families receiving them.
The entire 2006-2011 package of tax and benefit reforms, had a direct impact on households’ incomes since it increased real disposable incomes, on average, by 5.4%. Here, the households in the top income decile gained the most (9.2%). The lowest gains were found in the 3rd decile (3.4%). Moreover, the poorest 10% of households gained, on average, 5.7% from the introduction of the entire package.
The nature of these reforms had an interesting distribution in terms of age and family type with the highest gains going to working-age individuals, in particular to married couples with children (10.2%). On the other hand, single pension-age individuals saw their income fall slightly as a result of the reforms (-0.3%), and only small gains have been seen for pensioner couples (0.5%).
In the report, we set the implemented policies against promises and declarations made by the principal parties during electoral campaigns and government goals declared in the Prime Ministers’ exposé’s.
Out of the main policies implemented by the 2005-07 government, only the PIT reform of 2009 has been introduced in a form declared in the 2005 PiS electoral program. Its introduction was, however, legislated for 2009 and fell therefore under the current term of office. The introduced reductions in the rates of the SSC, one of the most costly reforms, were not mentioned in the electoral pledges.
Moreover, the declared form of the CTC in the electoral program of PiS, was very different from the one introduced in 2007. The introduced program centered on the theme of a “solidarity package”, whereas the declared CTC was to be focused on low-income families. The introduced policy, about 9 times as expensive as the declared one, transferred resources to low-income families but was most generous to high earners who pay enough tax to take advantage of the generous maximum amounts of the credit. The generosity of the CTC makes it the most costly “tax expenditure” item in the Polish system of direct taxes, with a value of 0.4% of GDP (Finance Ministry, 2010).
In terms of the PO’s program and the Prime Minister Tusk’s exposé’s, the report analyzes the focus on further reduction of taxes. In the midst of the financial crisis, the current coalition oversaw the introduction of the 2009 PIT reduction but withdrew from implementing a 15% flat tax, one of its flagship policies prior to 2007. However, despite a reduction in the basic rate of tax from 19% to 18%, income taxes grew on average among low and middle-income households (1-6th decile) because of the freezing of the tax credits. The net effect of income tax policies, in the current term of office, has meant gains for higher income households, with a substantial reduction in income taxes for those in the top decile group (on average 23%).
In light of the growing level of public debt, the current government implemented a VAT reform that raised indirect taxes by about 0.3% of GDP. The combination of an increased basic rate, with a reduction of lower rates on main food items, produced a proportional distribution of the tax burden.
Overall, the tax record of the current government is mixed. The implemented reductions were legislated already prior to its arrival, and the net result of the packages implemented in recent years hangs importantly on the level of households’ income. On average, only the top three deciles of households have seen their tax burden fall.
Each of the coalitions have their excuses for failing to deliver the promised policies. For the 2005-07 coalition, it is the early dissolution of Parliament. The current government, led by the Civic Platform, had to maneuver through the difficult years of the financial crisis and an economic slowdown. At the same time, one could interpret the policies implemented in the first two years of the 2005-07 Parliament as an expression of policy priorities, whereas the policies implemented during the current Parliament, can be confronted with their previous declarations to examine which groups of society they have prioritized.
In Poland, household income has grown fast in recent years. On the one hand, due to growing wages and earnings, on the other, due to introduced packages of tax and benefit reforms. Despite the financial crisis, the Polish economy has so far performed relatively well.
The reforms implemented in the last two terms of office, offer however little guidance to the credibility of electoral declarations on socio-economic policy. Even though the Law and Justice party (PiS), the leading party of the 2005-2007 government, legislated one of its key promises while in office (the PIT 2009 reform), it also implemented substantial reforms which were either not originally in their electoral program, or which took a very different shape and benefited other segments of the population. Even if the current government withdrew from the promises of further tax reductions when faced with the challenges of the financial crisis, it oversaw the implementation of significant tax cuts legislated in the 5th term of Parliament. Overall, however, the implemented policies increased taxes of lower income households.
To conclude, our results suggest that if Polish voters’ decisions are to be guided by declarations in the area of socio-economic policy, they will face a tricky choice on the 9th of October.
Figure 1. Changes in disposable incomes of Polish households as a result of tax and benefit policies implemented between 2006 and 2011, by income deciles.

Source: CenEA, Myck et al. (2011). Notes: average monthly values per household in a given decile group.
References
- Finance Ministry (2010) “Tax Expenditures in Poland”, Polish Finance Ministry, Warsaw.
- Morawski, L., and Myck, M. (2010) “‘Klin’-ing up: Effects of Polish Tax Reforms on Those In and on those Out”, Labour Economics, 17(3), str.556-566.
- Myck, M., Morawski, L., Domitrz, A., Semeniuk, A. (2011) „Raport Przedwyborczy CenEA, część I. 2006-2011: kto zyskał, a kto stracił?” (CenEA’s pre-election report: 2006-2011 who gained and who lost? ), Microsimulation Report 01/11, Centre for Economic Analysis, Szczecin.
Disclaimer: Opinions expressed in policy briefs and other publications are those of the authors; they do not necessarily reflect those of the FREE Network and its research institutes.
Tax Meat to Save the Baltic Sea

In a world of perfect markets, where prices are “right”, consumers’ choice should, with few exceptions, be limited only by their budget constraints. But in the case of agricultural products, the “right” prices are not in place. One reason is that producers in this sector do not bear the costs for the externalities they generate. Focusing on the case of the Baltic Sea, this brief provides some insights into why livestock producers are, by and large, exempted from environmental policies, and raises the question whether something should be done about it.
An Italian expression describes the attempt to juggle too many projects or attain too many goals at once, with the tacit implication that something is bound to fail. “Avere troppa carne al fuoco“: literally, to have too much meat on the grill. This, in a metaphorical but also quite literal sense, is the dominant impression left by some summer reading about the situation of the Baltic Sea.
The Baltic Sea is home to the world’s largest anthropogenic “dead zone”. The main culprit is the unsustainable livestock production in the region, generating externalities (i.e., costs that economic actors impose on others without paying a price for it) that short-circuit the functioning of the markets, creating a case for regulatory intervention. The concept of externalities is today most famously related to the issue of carbon dioxide emissions and climate change, felt by many as the most pressing challenge mankind has to deal with at present. In recent years, a lot of brain power has been spent on this, but there is more to environmental degradation and climate change than just CO2 and rising temperatures. A very conspicuous example is literally under our eyes, in the water body that lies between our lands. What should we do about it?
A Layman Understanding of the Background
For at least three decades, eutrophication (i.e., nutrient accumulation) and hypoxia (i.e., oxygen depletion) in the Baltic Sea has triggered and boosted each other in a vicious cycle. The nutrients discharged in the water fertilize the ocean floor resulting in an excess algal bloom. This underwater forest consumes oxygen, thus altering the balance between chemical elements in the water, so that even more nutrients are released and the cycle continues (for further references, see [16, 19, 21]). Beyond the algae and the decreased transparency of the water, these deep changes in the sea environment start to make them noticed in fish stocks depletion, but can more generally become devastating to both the marine and terrestrial ecosystems. Moreover, according to researchers, these conditions are going to increase the sensitivity of the area to the global climatic changes expected in the near future. This is seriously threatening a large part of economic activities in the whole catchment of the sea, an area of 22,500,000 km2 over nine countries with 85 million inhabitants.
Since 1974, all sources of pollution around the sea have been subject to a single convention, the Helsinki Convention, signed by the then seven Baltic coastal states. The Helsinki Commission, or HELCOM, is the governing body of the Convention, whose present Contracting Parties are Denmark, Estonia, the European Community, Finland, Germany, Latvia, Lithuania, Poland, Russia and Sweden. For over three decades, HELCOM has monitored the situation. Alarming reports have followed one upon the other, together with policy recommendations to the contracting parties.
As stated on its website, “the work of HELCOM has led to improvements in various fields, but further work is still needed [… and] the remaining challenges are more difficult than earlier obstacles”. Reductions in emissions achieved so far are low hanging fruits, concerning major point sources, such as larger cities’ sewage treatment plants and industrial wastewater outlets. Due to both technical and socio-economic obstacles, achieving further reductions will be a tougher task. This is because it is now time to address diffuse sources of nutrients such as run-off from over-fertilized agricultural lands. Nevertheless, according to numerous studies (among others, [19, 23]), a substantial reduction of the nutrient load discharged into the sea appears necessary in order to reduce further damage; all the more, so given that it takes many decades for the sea to recover. The question is hence whether more stringent policy instruments might be needed.
According to researchers at HELCOM, eutrophication of the Baltic Sea is due to the excess of nitrogen and phosphorus loads coming from land-based sources. About 75% of nitrogen and 52% of phosphorus come from agriculture and the livestock sector. In particular, the main reason for the sharp increase in nutrient loads during the last 50 years is the intensification and rationalization process. This was partly stimulated by the EU Common Agricultural Policy in its early phase, with a geographic separation between crop and animal production [6, 9, 10]. On the one hand, animal farms grew ever bigger, in the order of tens of thousands of animals for cattle, hundreds of thousands for swine and millions for chicken farms. These giant facilities produce way more manure than what could be absorbed by crop production in their vicinity. Cheap fodder to these extremely dense animal populations is produced on large scale crop fields elsewhere, too far away for transport of manure to be feasible and instead using high-yield chemical fertilizers. This way, the nutrient surplus is multiplied at both locations; it leaks through the ground or in the waterways from the big heaps of manure that cannot be properly stored or disposed of, and it leaks from the over-fertilized fields (shocking case studies are reported by HELCOM [11]).
However, a different type of agriculture exists in the area known as Ecological Recycling Agriculture (ERA). This is based on more traditional methods and means that farms have a lower animal density and use the manure as fertilizer in an integrated production of crop to be used for animal feed. In this way, ERA manages to better close the cycle of nutrients with very little dispersion to the environment. Scenarios simulations [12] show that, expanding the presence of ERA from the negligible shares it currently accounts for (between zero and a few percentage points, varying by sector and country) would contribute considerably to solving the problem. The nitrogen surplus discharged into the sea yearly could decrease by as much as 61% if all agricultural production in Poland and the Baltic states were converted to the standard of the best ERA facilities currently operating (the Swedish ones), without affecting the current volumes of crop and animal products. However, this is not likely to happen spontaneously, precisely because of the externalities discussed above. As long as the external costs are unaccounted for and ignored, scale economies push in the direction of concentration and intensification, which is the current development path of the sector.
A Difficult Question
Zooming out from the Baltic Sea and looking at the bigger picture, one starts to wonder why the agricultural sector is so seldom a part of environmental policy or even the debate. Recent research has raised awareness about the contribution of the agriculture and livestock sector to climate change [5, 8, 14, 17]. Beyond nitrogen and phosphorus, the expansion of livestock farming is behind the rising emissions of methane. It is the next most common greenhouse gas after CO2 and responsible for 19% of global warming from human activities. This is more than the share of all transportation in the world combined [18].
A new American Economic Review paper [13] provides a broad picture of the sources of air pollution in the American economy, for the first time computed separately by sector and industry, and with the purpose of incorporating externalities into national accounts. Crop production and livestock production stand out among the five industries with the largest gross external damage (GED), defined as the dollar value of emissions from sources within the industry. In fact, the agricultural sector has the highest GED to value added ratio.
However, greenhouse gases are not the only externality generated by livestock production. The animals’ living conditions under modern farming methods favor the emergence of infections and new diseases that reach much further than through direct consumption of related products, as the recent E. coli episode in Europe brought to attention. The generalized use of antibiotics in animal feed, legal and widespread in some countries [3], constitutes an even bigger health threat. This is because it has the potential of generating antibiotic-resistant mutations of bacteria against which we would be completely defenseless should they pass to humans.
Moreover, the public has from an animal-rights and ethics perspective become increasingly concerned about the animals’ living conditions. 77% of respondents to the Eurobarometer 2005 believe that the welfare-protection of farm animals in their country needs to be improved. 96% of American respondents to the Gallup 2003 survey say that animals deserve legal protection, and 76% say that animal welfare is more important than low meat prices. Additionally, a comparable share advocates passing strict laws concerning the treatment of farmed animals.
In rich countries, the increased share of meat in the diet, which has been stimulated by decreasing relative prices, constitutes according to some medical research a health hazard in itself. In developing countries, raising livestock is an inefficient and expensive converter of fossil fuels into calories for human consumption. In addition, fodder production often displaces other important land uses such as forests.
It is easy to rationalize the absence of these issues from the policy agenda. It is not just a matter of powerful lobbies. The ownership structure and size composition make the agricultural sector so heterogeneous that the challenges in regulating it can easily be imagined. Adding to this, is the special role of food in culture, the “local” products so often linked to national identity, the romantic idea of the land nourishing its people, and of course the strategic role of being food self-sufficient [7]. In the past, the latter was linked to wars and famines. Perhaps, even in our projections about the future, self-reliance in food production still plays an important role in the perspective of global climate changes and accordingly limited or modified trade flows. However, we cannot afford to grant this sector a special status and ignore all the social costs it generates. Can we learn anything from current research on how all these externalities should be addressed?
Policy Tools
In the terminology of Baumol and Oates’ classic book on environmental policy, instruments can be categorized as “command and control”. For example, explicit regulation of standards and technologies with associated prohibitions and sanctions; information provision, that then lets the power in the hands of the consumers; and price-based instruments, in the form of taxes, subsidies or trading schemes. These can be imposed on inputs or output, with different implications [4].
The relatively high-level standards of EU environmental legislation (legally stipulated maximum livestock density per hectare, requirements of minimum manure storage capacity, ban on winter manure spreading) is effectively enforced in some countries. In the newer members states, on the other hand, issues have been reported [15] in the form of incomplete translation of EU legislation into the national regulations and ineffective enforcing, significant examples of unlawful practices by foreign companies (e.g. Danish companies in Poland and Lithuania) and limited public access to environmental information. When it comes to non-EU members in the Baltic Sea area, these problems are scaled up, with very large animal farms, lack of many important environmental regulations (no limits on livestock density, capacity of manure storage or ammonia emissions from stored and utilized manure, too generous limits for amount of manure allowed, etc.) and an insufficient environmental information system.
Information undoubtedly plays an important role, but to rely on consumers’ pressure might not be sufficient to solve this type of issues. Consumers are not famously a very effective pressure group, because of organizational issues and the classic collective action problems. Direct regulation of activities is certainly necessary, especially when it comes to the most important rules of the game for producers. However, the heterogeneity of the sector creates a trade-off between environmental precision and transaction costs of implementation and control in practice. For example, the damage of nitrate leaching depends on the type of soil; the policy measure is precise when it restricts leaching losses on sites that have specific characteristics. However, the costs of enforcing measures only at these sites are high. Alternatively, curbing nitrate use in general has low transaction cost, but because it will also affect sites without problems of nitrate in the groundwater, it also has low precision. This may be considered unfair or illegitimate [24].
Another limit of this approach is the lack of flexibility: once a particular practice becomes forbidden, it is likely that some other behavior emerges from the creativity of the actors involved that was not foreseen by the norm but could potentially present the same problems as the forbidden one. This will happen as long as the private incentives of the actors are not aligned with the policy goal.
Often the best way to curb a particular activity that, as in this case, has a number of unwanted side effects, is not to ban it but to put a price on it. As in the case made for CO2, a market based approach could also in this area offer the advantage of being cost-effective and at the same time stimulate creative new solutions, e.g. new technologies for manure processing. Therefore, one immediate questions concerns why the agriculture sector is not included in the European emission trading scheme (ETS)?
The European Union launched already in 2005 its version of a cap and trade scheme, covering some 11,000 power stations and industrial plants in 30 countries. As from 2013, the scope of the European ETS will be extended to include more sectors such as aviation, but not agriculture or livestock. The main limitation of ETS is that it does not address spatial concentration problems. When emissions have an immediate effect on the local environment, permit trading does not guarantee the achievement of targets at each location. On the contrary, the possibility of trading emission permits combined with economies of scale might lead to the emergence of emission hotspots, sites with highly concentrated amounts of pollutants locally affecting the environment and the population. A proposed variation is a scheme for tradable concentration permits, either for manure [20] or for animal production [2]. A concentration permit is defined as the permission to deposit a quantity of pollutants at a specific location. The permits can then enter a trading system, but the use of the right remains linked to the site. Some authors believe that in practice, such systems generate high transaction costs and cannot achieve cost-effectiveness.
An input tax, for example on chemical fertilizers or imported fodder, or a direct tax on emissions would only affect the balance between domestic production and imports from countries that do not have the same regulation. Moreover, as discussed above, emissions are far from being the only problem. An alternative, as argued by Wirsenius, Hedenus and Mohlin at the Chalmers University of Technology and University of Gothenburg [22] is an output tax, i.e. a tax on meat consumption, on the grounds that costs of monitoring emissions are high, there are limited options for reducing emissions apart from output reduction, and the possibility for output substitution in the consumption basket are substantial. Moreover, a tax on consumption would avoid international competition from products that are not produced with the same standards.
A meat tax has shortly appeared in the public debate, for example in the Netherlands and in Sweden, but it has failed to gain much popularity so far. Meat consumption in the area has increased considerably in recent years –between 30% in Germany and 160% in Denmark since 1960 – and relative prices have fallen. By a combination of price and income effects, it has become a norm to eat meat every day, or even at every meal. It must be recognized, though, that while each single policy instrument discussed above has its shortcomings, because of the many interrelated aspects of the problem, a reduction in output, perhaps through a consumption tax, would address in a more comprehensive way all the different externalities related to meat production. After all, maybe there is just too much meat on our grills.
Recommended Further Readings
- [1] ”Slaktkropparnas kvalitet i ekologisk uppfödning”. Technical report, Ekokött, 2006.
- [2] J. Alkan-Olsson. Sustainable Water Management: Organization, Participation, Influence, Economy., volume 5, chapter Alternative economic instruments of control. VASTRA, Gothenburg University, 2004.
- [3] Mary D. Barton. “Antibiotic use in animal feed and its impact on human health”. Nutrition Research Reviews, 13:279–299, 2000.
- [4] W.J. Baumol and W.E. Oates. The theory of environmental policy. Cambridge Univ Pr, 1988.
- [5] J. Bellarby, B. Foereid, and A. Hastings. Cool Farming: Climate impacts of agriculture and mitigation potential. Greenpeace International, 2008.
- [6] M. Brandt and H. Ejhed. Trk transport-retention-källfördelning. Belastning på havet. Naturvårdsverket Rapport, 5247, 2002.
- [7] F. Braudel, S. Reynolds, and S. Reynolds. The structures of everyday life: The limits of the possible. Harper & Row, Publ., 1981.
- [8] A. Golub, B. Henderson, and T. Hertel. Ghg mitigation policies in livestock sectors: Competitiveness, emission leakage and food security. In Agricultural and Applied Economics Association 2011 Annual Meeting, July 24-26, 2011, Pittsburgh, Pennsylvania. Agricultural and Applied Economics Association, 2011.
- [9] A. Granstedt. Increasing the efficiency of plant nutrient recycling within the agricultural system as a way of reducing the load to the environment–experience from Sweden and Finland. Agriculture, ecosystems & environment, 80(1-2):169–185, 2000.
- [10] A. Granstedt and M. Larsson. “Sustainable governance of the agriculture and the Baltic Sea – agricultural reforms”, food production and curbed eutrophication. Ecological Economics, 69:1943–1951, 2010.
- [11] HELCOM. “Balthazar project 2009-2010: Reducing nutrient loading from large scale animal farming in Russia”. Technical report, 2010.
- [12] M. Larsson and A. Granstedt. “Sustainable governance of the agriculture and the Baltic Sea–agricultural reforms, food production and curbed eutrophication”. Ecological Economics, 69(10):1943–1951, 2010.
- [13] Nicholas Z. Muller, Robert Mendelsohn, and William Nordhaus. “Environmental accounting for pollution in the United States economy”. American Economic Review, 101:1649–1675, 2011.
- [14] T. Nauclér and P.A. Enkvist. “Pathways to a low-carbon economy: Version 2 of the global greenhouse gas abatement cost curve”. McKinsey & Company, pages 26–31, 2009.
- [15] J. Skorupski. “Report on industrial swine and cattle farming in the Baltic Sea catchment area”. Technical report, Coalition Clean Baltic, 2006.
- [16] B. Smith, A. Aasa, R. Ahas, T. Blenckner, T.V. Callaghan, J. Chazal, C. Humborg, A.M. Jönsson, S. Kellomäki, A. Kull, et al. “Climate-related change in terrestrial and freshwater ecosystems”. Assessment of Climate Change for the Baltic Sea Basin, pages 221–308, 2008.
- [17] P. Smith, D. Martino, Z. Cai, D. Gwary, H. Janzen, P. Kumar, B. McCarl, S. Ogle, F. OMara, C. Rice, et al. “Greenhouse gas mitigation in agriculture”. Philosophical Transactions of the Royal Society of London, Series B: Biological Sciences, 363(1492):789–813, 2008.
- [18] H. Steinfeld, P. Gerber, T. Wassenaar, V. Castel, M. Rosales, and C. de Haan. “Livestock’s long shadow: environmental issues and options”. 2006.
- [19] E. Vahtera, D.J. Conley, B.G. Gustafsson, H. Kuosa, H. Pitkänen, O.P. Savchuk, T. Tamminen, M. Viitasalo, M. Voss, N. Wasmund, et al. “Internal ecosystem feedbacks enhance nitrogen-fixing cyanobacteria blooms and complicate management in the Baltic Sea”. AMBIO: A journal of the Human Environment, 36(2):186–194, 2007.
- [20] B. Van der Straeten, J. Buysse, S. Nolte, L. Lauwers, D. Claeys, and G. Van Huylenbroeck. “Markets of concentration permits: The case of manure policy”. Ecological Economics, 2011.
- [21] H. von Storch and A. Omstedt. “The BALTEX Assessment of Climate Change for the Baltic Sea basin, chapter Introduction and summary”. Berlin, Germany: Springer., 2008.
- [22] S. Wirsenius, F. Hedenus, and K. Mohlin. “Greenhouse gas taxes on animal food products: rationale, tax scheme and climate mitigation effects”. Climatic Change, pages 1–26, 2010.
- [23] F. Wulff, O.P. Savchuk, A. Sokolov, C. Humborg, and C.M. Mörth. “Management options and effects on a marine ecosystem: assessing the future of the Baltic”. AMBIO: A Journal of the Human Environment, 36(2):243–249, 2007.
- [24] O. Oenema. “Governmental policies and measures regulating nitrogen and phosphorus from animal manure in European agriculture”. Journal of Animal Science, 2004.
Disclaimer: Opinions expressed in policy briefs and other publications are those of the authors; they do not necessarily reflect those of the FREE Network and its research institutes.
Between East and West: Regional Trade Policy for Ukraine

Given Ukraine’s geographical location between Europe and Russia, the country often has to make difficult choices in its foreign policy. Trade policy is not an exception. In particular, Ukraine is currently negotiating a comprehensive free trade agreement with the EU, which is fostering hopes of joining it in the near future. However, at the same time, Russia is ‘inviting’ Ukraine to join the Customs Union it has created together with two other former Soviet Republics; Belarus and Kazakhstan. Since Ukraine cannot be part of both regional agreements simultaneously, it will again have to choose between the EU and Russia.
Over the last decade, the European Union has become the most important trading partner of Ukraine. The share of Ukraine’s exports of goods to the EU is now around 25-30 percent, while its share in Ukraine’s exports of services has increased twofold from 17 percent in 1994 to 34 percent in 2008. The share of Ukraine’s imports from the EU is even larger: around 35 percent in goods and more than 50 percent in services. This growth in trade shares has occurred despite the fact that there are still substantial barriers, both tariff and non-tariff, to free trade between Ukraine and the EU. The Free Trade Agreement (FTA) which Ukraine and the EU are currently negotiating is intended to remove many of these barriers.
The EU-Ukraine FTA is part of the so-called New Enhanced Agreement between the EU and Ukraine and consists of a set of provisions stipulating the liberalization of trade in goods and services, capital movement and payments, and government procurement.
A big part of the agreement is devoted to the trade in goods. This is perhaps not surprisingly so given that trade in goods accounts for 80 percent of their total bilateral trade in goods and services. Tariffs that Ukraine currently applies to the EU non-agricultural imports vary from 0 to around 20 percent. Under the new agreement, the tariffs on many of these goods will be reduced.
Apart from tariffs, the agreement stipulates an elimination of many non-tariff barriers to trade. This will be achieved by harmonization and simplification of the procedures related to customs and licensing, capital movement, government procurement, and intellectual property rights (IPR) protection, as well as competition policy, energy security and others. Ukrainian legislation must be standardized to conform to the respective European laws, with some procedures becoming more transparent (tenders), while others becoming more stringent (IPR). For example, Ukrainian producers will have to abide by the legislation on trademarks and geographical names. According to the Ukrainian deputy minister of Economy, the EU has offered a grace period of 5-10 years to Ukrainian producers to re-brand their products.
The FTA negotiation process between the EU and Ukraine started on February 18, 2008. Since then, more than fifteen rounds have taken place. Initially, there were hopes that the agreement would be signed before the end of 2010. However, in the fall of 2010, it became clear that this was not going to happen. Currently, the more pessimistic experts expect the agreement to be signed only in 2013.
In parallel with the EU integration processes, Russia, Belarus and Kazakhstan have created a customs union and are actively trying to involve Ukraine in their union. On the one hand, the Customs Union is attractive for Ukraine since it offers free trade with Russia, which is still one of Ukraine’s biggest trading partners, both in terms of imports and exports.
This union promises access to cheaper energy resources, which would be beneficial for Ukraine given its high energy dependence, especially in the exporting sectors like metals and chemicals. However, joining this Customs Union would jeopardize the FTA negotiations with the EU and would even endanger the WTO membership of Ukraine.
So far, the Ukrainian government has not taken a clear stance on whether Ukraine is going to become a full member of the Customs Union. Instead, it has cautiously offered a “3+1” arrangement.
In the light of the above discussion, the natural question to ask is then: what integration strategy would Ukraine benefit the most from?
Regional Trade Agreements
The idea that regional trade agreements (RTA) are beneficial to a country is best supported by the fact that such agreements have become increasingly popular over the last twenty years. As of July 31, 2010, there were around 400 RTAs reported to the WTO with 193 being in force. According to the World Bank, on average, a WTO member has regional agreements with more than 15 partner countries. RTAs exist predominantly as free trade agreements (FTA) and customs unions (CU). The former removes barriers to trade in goods and services among member countries but allows individual members to set their own tariffs against third parties. The latter type is a stricter arrangement since customs unions act as a single agent in the world markets and have a unified external tariff regime.
The analysis of RTAs and customs unions in particular, dates back to Viner in 1950 who introduced the terms trade creation versus trade diversion. Trade creation refers to a situation where member countries begin to trade goods and services with each other after the creation of an RTA, whereas previously they produced them domestically. Trade diversion, on the other hand, occurs when member countries shift their imports from outside partners to inside partners. Obviously, while trade creation is viewed as a good consequence of a RTA, trade diversion is undesirable. This, since the lower tariffs, make member countries shift away from the most efficient outside producer to an RTA partner.
There are two approaches in the literature to evaluate the impact of the RTAs: gravity models and general equilibrium (GE) models. Gravity models are estimated on the actual trade data while GE models are used for simulations. The typical findings on the effect of RTA’s are that: (a) excluded countries almost always lose, (b) there is a trade creation effect but it is rather small, and (c) the effect of the RTAs differs across their members, in particular, smaller countries tend to experience a larger increase in their exports (World Bank, 2005; Berthelon, 2004).
In addition, the so-called South-North RTAs (agreements between developed and developing countries), are found to be more beneficial for the latter than South-South agreements. Finally, the literature shows that on average FTAs are associated with lower levels of tariffs compared to customs unions.
Ukraine’s Choice of Trade Policy
The above presented empirical findings on existing RTAs, can offer guidance in which of the regional agreements Ukraine would benefit the most from. First, on the one hand, both of the FTA with the EU and the Customs Union with Russia are likely to lead to higher trade volumes (trade creation). On the other hand, the FTA with the EU can be regarded as a South-North agreement and could, therefore, be expected to have larger benefits for Ukraine than the Customs Union with Russia. Another argument in favor of the EU-FTA, is that Ukraine’s other trading partners are likely to face higher tariffs if Ukraine became a member of the Customs Union, than if she signed an FTA with the EU.
A recent study by Shepotylo (2010) addresses this issue and can be used as a benchmark for the analysis. Shepotylo uses a gravity model to compare potential export gains from deeper integration with the CIS countries to those from integration with the EU. Shepotylo’s analysis evaluates whether integration would be trade creating or not, leaving aside the issue of trade diversion.
Based on past experiences of Eastern European and CIS countries, Shepotylo builds two thought experiments. The first one is based on the scenario in which Ukraine would have become more deeply integrated into the CIS structure. That is, the experiment allows us to see what would have happened to Ukrainian foreign trade over the period 2004-2007 if Ukraine had developed closer ties with the CIS countries. The second experiment envisages what would have happened if Ukraine would have joined the EU in 2004.
According to the results, Ukraine would have benefited under both integration scenarios relative to the current situation of no integration. However, the benefits would have been twice as high under the EU integration strategy. Shepotylo’s results suggest that the EU integration could have increased Ukrainian exports in 2004-2007 by 10 percent, while the deeper CIS integration would only have increased exports by about 4 percent.
The highest expected benefits of Ukraine’s integration into the EU would have come from a substantial increase in export of various types of machinery and equipment, road vehicles and transport equipment, as well as apparel and closing accessories. These gains would have been virtually uniformly positive and economically large across all groups of countries regardless of the membership in EU. For example, export of road vehicles to the CIS countries would have been 88 percent higher under the EU integration scenario than under the CIS integration scenario, while their exports to the Western Europe would have been 82 percent higher. The export of raw materials, on the other hand, would have either declined (nonferrous metals), or remained relatively stable (iron and steel).
More importantly, gains under the EU scenario would also have come from a more diversified trade structure. A higher export diversification would be achieved because of the rapid expansion of manufactured exports, the share of which in total export would have been 26 percent under the EU scenario and only 16 percent under the CIS scenario.
In our view, diversification of trade flows is very important since a more diversified export structure with a high share of manufactured products can better protect a country from negative terms-of-trade shocks. For example, export diversification reduces the effect of idiosyncratic shocks. This was found by Koren and Tenreyro (2007). According to their findings, low-income countries which specialize in fewer and more volatile sectors, experience higher aggregate volatility in terms of GDP growth rates and trade volumes, etc. Another reason to why a more diversified trade flow (i.e. moving away from exports of primary goods to exports of manufactured products) is desirable, is the general trend of declining prices of primary commodities relative to the prices of manufactured goods. Also, a diversified export structure with a higher share of technologically advanced products has been found to be conducive for higher economic growth (Hausmann et al., 2007).
Conclusion
The above analysis suggests that signing a deep FTA with the EU would benefit Ukraine the most. This, given that it is likely to lead to a substantial increase in total exports and a favorable change in export composition towards a more diversified structure with a higher share of technologically advanced goods. These developments could in turn lower macroeconomic volatility and boost economic growth. Also, the EU integration scenario considered by Shepotylo (2010) did not allow for a substantial liberalization of trade in agriculture – an area where the large EU market is most protected. If the Ukrainian government manages to negotiate more open trade in agriculture, Ukraine may potentially gain much more than predicted in Shepotylo’s experiment.
On the other hand, joining the Customs Union with Russia would enhance the trade with its members and secure a lower price for energy resources. However, the benefits are likely to be outweighed by the potential losses of other markets and complications with the WTO due to the increased level of protectionism – an inevitable consequence of joining the Customs Union. In addition, the Ukrainian trade structure would become even more concentrated and skewed towards primary commodities, making the country even more vulnerable to shocks and slowing down its economic development.
Recommended Further Reading
- Berthelon, Matias (2004) “Growth Effects of Regional Integration Agreements”, Working Papers Central Bank of Chile No 278.
- Freund, Caroline and Emanuel Ornelas (2010) “Regional Trade Agreements“, World Bank Policy Research Working Paper No. 5314.
- Harrison, Glenn W., Thomas F. Rutherford and David Tarr (2003) “Rules of Thumb for Evaluating Preferential Trading Arrangements: Evidence from Computable General Equilibrium Assessments“, World Bank Policy Research Working Paper Series No. 3149.
- International Centre for Policy Studies (2007) “Free Trade between Ukraine and the EU: An impact assessment”.
- Hausmann, Ricardo, Hwang, Jason, Rodrik, Dani (2007) “What You Export Matters”, Journal of Economic Growth 12, No. 1, 1-25.
- Koren, Miklos, Tenreyro, Silvana (2007) “Volatility and Development”, Quarterly Journal of Economics 122, 243-287.
- Lederman, Daniel, Maloney, William F. (2003) “Trade Structure and Growth”, World Bank Policy Research Working Paper No. 3025.
- Shepotylo, O (2010) “A Gravity Model of Net Benefits of EU Membership: The Case of Ukraine”, Journal of Economic Integration, 25-4: 676-702.
- World Bank (2005) “The Global Economic Prospects 2005: Trade, Regionalism and Development”, Washington D.C.
Disclaimer: Opinions expressed in policy briefs and other publications are those of the authors; they do not necessarily reflect those of the FREE Network and its research institutes.